%22%3E%3C/path%3E%3Cpath d=%22M 63.072 7.554 C 62.258 8.022 61.577 8.689 61.092 9.493 L 61.092 7.076 L 57.158 7.076 L 57.158 22.64 L 61.089 22.64 L 61.089 14.888 C 61.089 13.446 61.403 12.434 62.03 11.853 C 62.818 11.218 63.818 10.907 64.826 10.982 L 65.868 10.982 L 65.868 6.851 C 64.891 6.834 63.926 7.076 63.073 7.554 Z%22 fill=%22rgb(17,17,17)%22%3E%3C/path%3E%3Cpath d=%22M 78.916 7.82 C 76.363 6.49 73.321 6.49 70.768 7.82 C 69.562 8.473 68.564 9.451 67.888 10.644 C 67.167 11.931 66.803 13.387 66.834 14.862 C 66.804 16.332 67.157 17.785 67.86 19.077 C 68.515 20.267 69.494 21.246 70.684 21.901 C 71.924 22.576 73.318 22.92 74.73 22.898 C 76.164 22.918 77.58 22.575 78.846 21.901 C 80.062 21.247 81.073 20.27 81.768 19.077 C 82.506 17.797 82.88 16.339 82.85 14.862 C 82.88 13.389 82.517 11.934 81.797 10.647 C 81.12 9.455 80.122 8.477 78.917 7.824 M 78.803 14.862 C 78.829 15.739 78.636 16.608 78.241 17.391 C 77.903 18.046 77.38 18.588 76.738 18.95 C 76.124 19.293 75.432 19.472 74.729 19.47 C 73.668 19.497 72.648 19.061 71.934 18.276 C 71.139 17.323 70.741 16.1 70.823 14.862 C 70.741 13.62 71.149 12.395 71.959 11.45 C 72.687 10.667 73.715 10.233 74.783 10.256 C 75.859 10.236 76.894 10.67 77.635 11.45 C 78.464 12.387 78.884 13.616 78.801 14.864%22 fill=%22rgb(17,17,17)%22%3E%3C/path%3E%3Cpath d=%22M 95.906 7.076 L 95.906 15.646 C 95.975 16.68 95.643 17.701 94.979 18.498 C 94.311 19.184 93.379 19.547 92.422 19.495 C 91.475 19.544 90.553 19.18 89.894 18.498 C 89.23 17.701 88.898 16.68 88.967 15.646 L 88.967 7.076 L 85.033 7.076 L 85.033 16.207 C 85 17.449 85.275 18.68 85.834 19.79 C 86.327 20.75 87.095 21.542 88.039 22.065 C 89.033 22.594 90.145 22.861 91.271 22.838 C 92.188 22.847 93.095 22.65 93.926 22.263 C 94.708 21.905 95.388 21.36 95.906 20.675 L 95.906 22.645 L 99.865 22.645 L 99.865 7.076 Z%22 fill=%22rgb(17,17,17)%22%3E%3C/path%3E%3Cpath d=%22M 4.513 15.626 C 4.511 10.815 7.606 6.549 12.181 5.059 C 16.756 3.57 21.77 5.195 24.601 9.086 L 27.816 5.87 C 24.074 1.186 17.981 -0.943 12.137 0.393 C 6.292 1.728 1.728 6.292 0.393 12.137 C -0.943 17.981 1.186 24.074 5.87 27.816 L 9.085 24.601 C 6.214 22.512 4.515 19.177 4.513 15.626%22 fill=%22rgb(32,62,235)%22%3E%3C/path%3E%3Cpath d=%22M 17.114 14.343 L 13.354 18.01 L 13.354 18.026 L 21.071 18.026 L 11.412 27.609 L 17.389 27.609 L 23.999 21.081 L 23.999 28.316 L 24.005 28.316 L 27.967 24.393 L 27.967 14.343 Z%22 fill=%22rgb(32,62,235)%22%3E%3C/path%3E%3C/g%3E%3C/svg%3E) ×
× ××
××

Split your accounts between five reps at random and the biggest territory will be worth about twice the smallest. Not because anyone did anything wrong. Because account value is skewed, and skew does not average out at the sizes a sales team actually works with.
Which means the gap between your best and worst performer may be a gap in the draw rather than a gap in the people. Nobody checks, because almost nobody measures how unequal their territories are.
TL;DR
B2B account value is heavily concentrated, so any allocation that ignores value produces territories of very different worth. In our simulation of 250 accounts across 5 territories, drawn from a realistically skewed distribution where the top 20 percent of accounts hold about 72 percent of the value, a random split gave a median 2.0 times gap between the largest and smallest territory, and in the worst tenth of splits a 3.0 times gap. Geography and alphabet are random with respect to value, so they produce the same result. Two fixes remove most of it: deal accounts out in a snake draft ordered by value, which cut the gap to about 1.2 times, or greedily assign each account to the currently smallest territory, which closed it almost entirely. Then measure what you have built, using the same coefficient economists use for income inequality, and publish the number alongside quota attainment, because attainment differences smaller than your territory inequality are not telling you anything about your reps.
Why any value-blind split fails
Start with the distribution, because everything follows from it. In B2B, a minority of accounts holds most of the addressable value. In the simulation underpinning this article, the top 20 percent of accounts held roughly 72 percent of the total, which gives an account-level Gini coefficient of about 0.69. That is a more unequal distribution than the income of any country on earth.
Now split that at random and watch what happens. With a distribution that skewed, whichever territory happens to receive two of the largest accounts is worth far more than the one that receives none, and no amount of equalising the account count fixes it, because the count was never the thing that varied.
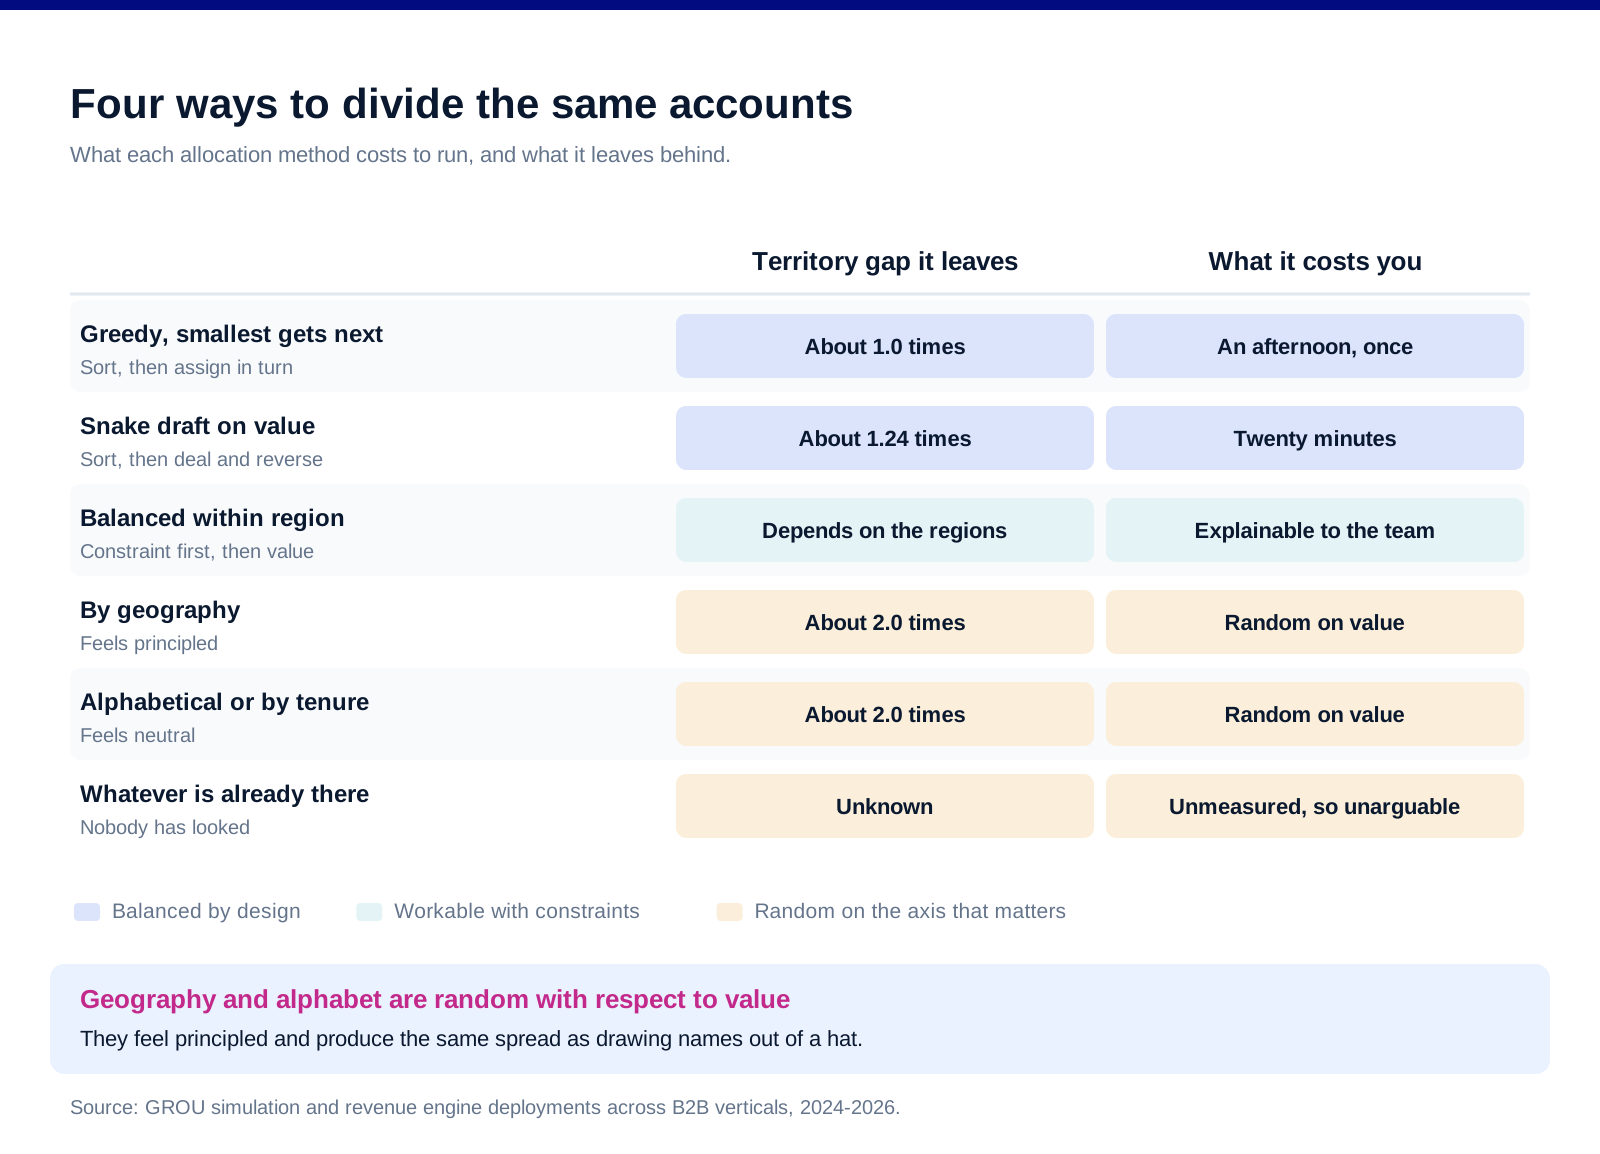
Geography and alphabet are random with respect to value. This is the part that surprises people. Splitting by region or by first letter feels principled and is, statistically, a random draw as far as value is concerned, so it produces exactly the same inequality as drawing names from a hat.
And it does not average out at the sizes you work with. Averaging rescues you when the numbers are large and the distribution is not too skewed. A sales team has five or ten territories and a heavy tail, which is precisely the case where it does not.
How unequal, exactly
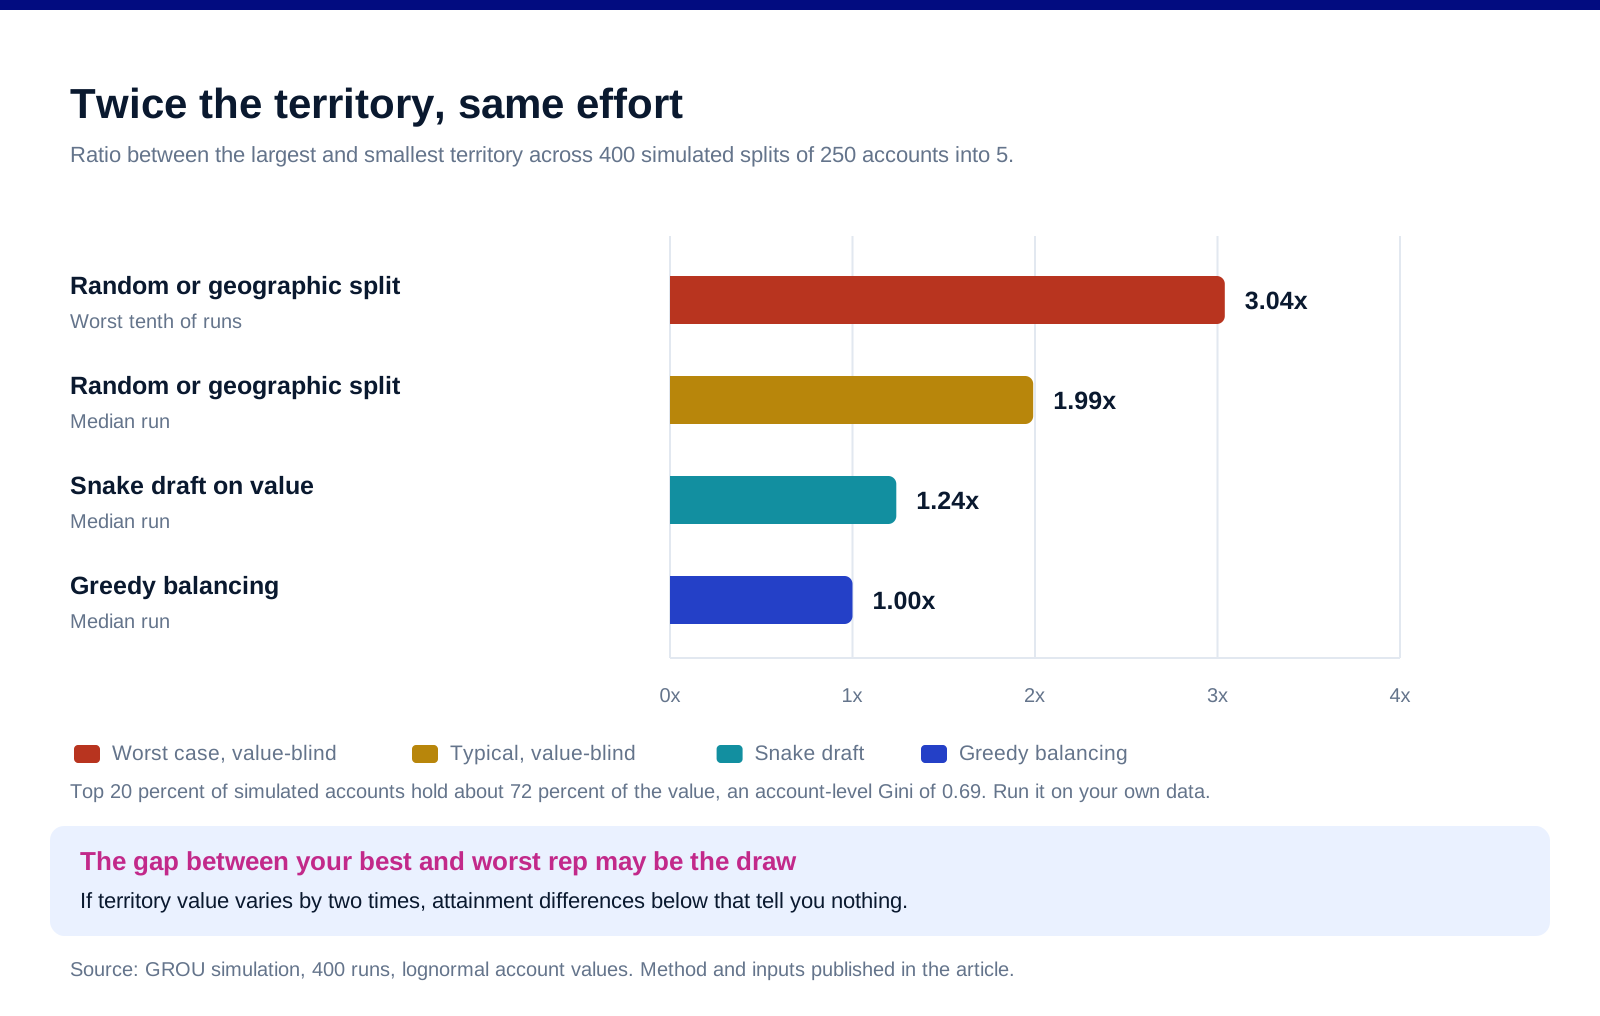
Random or value-blind allocation. Across 400 simulated runs of 250 accounts into 5 territories, the median ratio between the largest and smallest territory was 2.0 times. In the worst tenth of runs it reached 3.0 times.
A snake draft ordered by value. Rank every account by value, then deal them out one to each territory and back again, so the territory that took the largest account takes the last pick in the next round. That cut the median gap to about 1.24 times.
Greedy balancing. Sort accounts by value, then assign each one in turn to whichever territory currently has the least. In the simulation this closed the gap almost completely, to about 1.0 times.
The pattern holds at other sizes. With 500 accounts across 5 territories a random split still gave a median 1.64 times gap. With 120 accounts across 4 territories it gave 2.09 times. Smaller books are worse, which is the opposite of the intuition that a small team is simpler to balance.
Run it on your own numbers before you believe ours. The distribution shape matters, and yours will not be identical. The method is the point: simulate the split you are about to make, several hundred times, and look at the spread before you commit anyone's year to it.
[SCREENSHOT NEEDED: a spreadsheet showing account value sorted descending with the cumulative percentage column, to reveal the concentration]
Measure the inequality you have built
Borrow the tool economists use. The World Bank defines the Gini index as measuring "the extent to which the distribution of income (or, in some cases, consumption expenditure) among individuals or households within an economy deviates from a perfectly equal distribution", where "a Gini index of 0 represents perfect equality, while an index of 100 implies perfect inequality."
Apply it to territories rather than to people. Take each territory's total addressable value, compute the Gini across them, and you have a single number describing how fairly you have divided the opportunity.
Our simulated figures give you a scale. Random allocation produced a territory Gini of about 0.13. The snake draft produced about 0.04. Those are small-looking numbers attached to a 2.0 times gap and a 1.24 times gap respectively, which is a good reason to publish the ratio alongside the coefficient rather than the coefficient alone.
Then set a threshold and hold to it. Something like: no territory more than 20 percent above or below the mean, checked at every reallocation. A rule you can fail is worth more than a principle you cannot.
And publish it next to quota attainment. If your territories vary by 2 times and your reps' attainment varies by 30 percent, the attainment differences are inside the noise your allocation created, and any conclusion drawn from them is about the draw. Our note on SDR compensation plans covers what that means for paying people fairly.
Value is not the only axis, but it is the one people skip
Workload is a separate constraint from value. A territory of forty small accounts and a territory of eight large ones can be worth the same and require completely different amounts of time. Balance both or state explicitly which one you are optimising.
Existing relationships beat marginal balance. A rep who has worked an account for two years carries knowledge that will not transfer in a handover. Moving that account to make a spreadsheet symmetrical usually costs more than the imbalance did.
Travel and time zones are real constraints in the territories where they apply. Which is fewer territories than it used to be, and worth checking rather than assuming.
Language and regulatory coverage are hard constraints, not preferences. Do these first, as exclusions, then balance value within what remains. Trying to optimise everything simultaneously produces a model nobody can explain to the people it affects.
Do it in that order and the process is defensible. Hard constraints, then relationships, then value balance, then workload. Every step you can justify out loud is a step you will not have to renegotiate in January.
[SCREENSHOT NEEDED: a CRM territory view showing account owner alongside account value, with the totals per owner visible]
Reallocation, which is the part that actually hurts
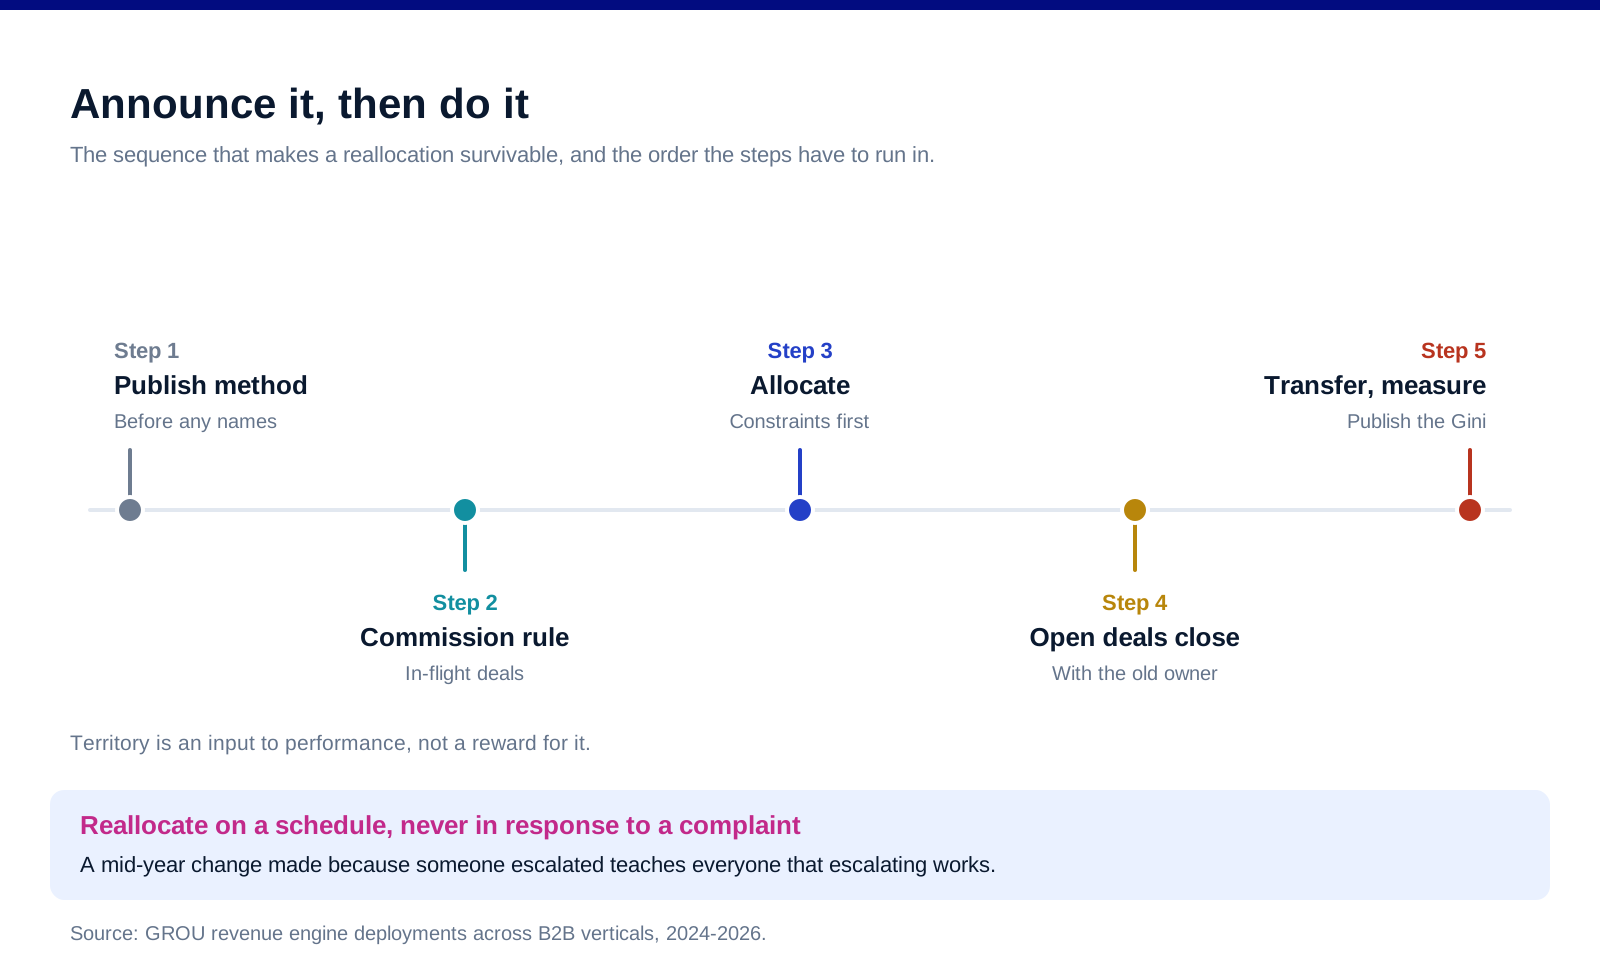
Reallocate on a schedule, not on a complaint. An annual cycle announced in advance is absorbed. A mid-year change made because someone escalated teaches everyone that escalating works.
Protect open opportunities through their close. Moving an account with a live deal in it destroys value for everyone including the customer. Let it close, then transfer.
Say what happens to commission on in-flight deals before you move anything. This is the single most predictable source of disputes and it takes one paragraph to prevent.
Do not reallocate to punish or reward. Territory is the input to performance, not an output of it. Using it as a reward makes next year's attainment data uninterpretable and everybody knows it.
Tell people the method, not just the outcome. A rep who understands that accounts were dealt in a value-ranked snake draft will argue with the inputs. A rep who is handed a list will assume politics, and will often be right.
Your CRM should hold the allocation, not a spreadsheet. Pipedrive and every comparable system supports owner-level views and reporting, which is what makes the balance checkable at any time rather than at the moment you built it. Our Pipedrive review covers the tool itself.
Two reasons the method now has to be written down
Territory determines earnings, which makes it a contractual question. In the UK, the Acas guidance on changing an employment contract is that "You must both agree to the changes. This is unless there's a clause in the contract that allows you to make a change without agreement", and that imposing a change without proper consultation risks "legal claims, for example claims of breach of contract or constructive dismissal". Whether a territory move is a contract change depends on your contracts, which is a question worth answering once rather than during a dispute.
And an unexplainable allocation is now a reporting problem as well as a fairness one. Under the EU pay transparency directive, the European Commission's summary states that employers "with at least 100 employees" must "publish information on the pay gap between female and male workers", and must "carry out a pay assessment if pay reports reveal a gender pay gap of at least 5% that cannot be justified."
Read the phrase "that cannot be justified" as an instruction about documentation. Commission is pay. If territory value is allocated in a way that happens to correlate with who works where, the earnings difference lands in a figure you now have to publish and account for. A documented, value-ranked allocation is a justification. A spreadsheet nobody can explain is the opposite of one.
Which is the same conclusion the fairness argument reaches by a different road. Write down the method, apply it consistently, keep the working. This is not legal advice and both positions vary by jurisdiction and by your own contracts.
What we do not publish here
A recommended number of accounts per rep. It depends on deal size, cycle length and how much of the work is account management rather than acquisition, none of which we know about you.
Quota attainment or territory value benchmarks. Ours come from a specific set of clients and markets.
A claim that balanced territories improve performance. We have not run a controlled test, and a fair allocation is defensible on its own terms whether or not it raises the aggregate number.
Any specific distribution as typical of B2B. The simulation uses a plausible skew and the article says so. Run it on your own data rather than adopting our shape.
A recommendation between territory models by industry. The constraints differ too much and the honest answer is the ordered process above rather than a template.
FAQ
How should you divide sales territories fairly?
Apply hard constraints first, such as language and regulatory coverage, then preserve existing relationships, then balance the remaining accounts by value using a snake draft or greedy assignment rather than by geography or alphabet, then check workload. Measure the result and publish it.
Why do random or geographic territory splits go wrong?
Because account value is heavily concentrated and geography is random with respect to value. In our simulation of 250 accounts across 5 territories, a value-blind split produced a median 2.0 times gap between the largest and smallest territory, rising to 3.0 times in the worst tenth of runs.
What is a snake draft for account allocation?
Rank accounts by value, deal one to each territory in order, then reverse the order for the next round so the territory that picked first picks last. In our simulation it cut the largest-to-smallest gap from about 2.0 times to about 1.24 times, for essentially no extra effort.
How do you measure whether territories are balanced?
Compute the Gini coefficient across territory totals, the same measure used for income inequality, where 0 is perfect equality. Publish it alongside the ratio between the largest and smallest territory, because the ratio is easier for people to interpret.
How often should you reallocate territories?
On an announced annual cycle rather than in response to complaints, protecting open opportunities through their close and stating the commission treatment for in-flight deals in advance.
Does territory balance actually improve results?
We have not tested that and we are not going to claim it. What we will claim is narrower: if territory value varies by more than performance varies, your performance data cannot separate the reps from the draw.
Bottom line
Sort your accounts by value and look at the concentration before you do anything else, because that single column explains why value-blind allocation fails. Then stop splitting by geography or alphabet, which are random with respect to value and produce a roughly two times gap between the best and worst territory at the sizes sales teams actually run. Deal the accounts in a value-ranked snake draft or assign greedily to the smallest territory, which costs an afternoon and removes most of the inequality. Measure what you built with a Gini coefficient and publish it beside quota attainment, so that everyone can see whether the performance spread is bigger or smaller than the spread you handed out. And when you reallocate, do it on a schedule, protect the open deals, and explain the method rather than the outcome.
Want the pipeline built rather than the territories redrawn? Book a call with GROU. We run lead generation and outbound inside B2B revenue engines across verticals.
We are GROU, a B2B pipeline agency that runs lead generation, outbound, and LinkedIn content for clients across manufacturing, fintech, iGaming, software, and professional services. Some links in this article are affiliate links, including Pipedrive. The allocation figures are our own simulation, with the method and inputs stated so you can reproduce them on your own data.
Split your accounts between five reps at random and the biggest territory will be worth about twice the smallest. Not because anyone did anything wrong. Because account value is skewed, and skew does not average out at the sizes a sales team actually works with.
Which means the gap between your best and worst performer may be a gap in the draw rather than a gap in the people. Nobody checks, because almost nobody measures how unequal their territories are.
TL;DR
B2B account value is heavily concentrated, so any allocation that ignores value produces territories of very different worth. In our simulation of 250 accounts across 5 territories, drawn from a realistically skewed distribution where the top 20 percent of accounts hold about 72 percent of the value, a random split gave a median 2.0 times gap between the largest and smallest territory, and in the worst tenth of splits a 3.0 times gap. Geography and alphabet are random with respect to value, so they produce the same result. Two fixes remove most of it: deal accounts out in a snake draft ordered by value, which cut the gap to about 1.2 times, or greedily assign each account to the currently smallest territory, which closed it almost entirely. Then measure what you have built, using the same coefficient economists use for income inequality, and publish the number alongside quota attainment, because attainment differences smaller than your territory inequality are not telling you anything about your reps.
Why any value-blind split fails
Start with the distribution, because everything follows from it. In B2B, a minority of accounts holds most of the addressable value. In the simulation underpinning this article, the top 20 percent of accounts held roughly 72 percent of the total, which gives an account-level Gini coefficient of about 0.69. That is a more unequal distribution than the income of any country on earth.
Now split that at random and watch what happens. With a distribution that skewed, whichever territory happens to receive two of the largest accounts is worth far more than the one that receives none, and no amount of equalising the account count fixes it, because the count was never the thing that varied.
Geography and alphabet are random with respect to value. This is the part that surprises people. Splitting by region or by first letter feels principled and is, statistically, a random draw as far as value is concerned, so it produces exactly the same inequality as drawing names from a hat.
And it does not average out at the sizes you work with. Averaging rescues you when the numbers are large and the distribution is not too skewed. A sales team has five or ten territories and a heavy tail, which is precisely the case where it does not.
How unequal, exactly
Random or value-blind allocation. Across 400 simulated runs of 250 accounts into 5 territories, the median ratio between the largest and smallest territory was 2.0 times. In the worst tenth of runs it reached 3.0 times.
A snake draft ordered by value. Rank every account by value, then deal them out one to each territory and back again, so the territory that took the largest account takes the last pick in the next round. That cut the median gap to about 1.24 times.
Greedy balancing. Sort accounts by value, then assign each one in turn to whichever territory currently has the least. In the simulation this closed the gap almost completely, to about 1.0 times.
The pattern holds at other sizes. With 500 accounts across 5 territories a random split still gave a median 1.64 times gap. With 120 accounts across 4 territories it gave 2.09 times. Smaller books are worse, which is the opposite of the intuition that a small team is simpler to balance.
Run it on your own numbers before you believe ours. The distribution shape matters, and yours will not be identical. The method is the point: simulate the split you are about to make, several hundred times, and look at the spread before you commit anyone's year to it.
[SCREENSHOT NEEDED: a spreadsheet showing account value sorted descending with the cumulative percentage column, to reveal the concentration]
Measure the inequality you have built
Borrow the tool economists use. The World Bank defines the Gini index as measuring "the extent to which the distribution of income (or, in some cases, consumption expenditure) among individuals or households within an economy deviates from a perfectly equal distribution", where "a Gini index of 0 represents perfect equality, while an index of 100 implies perfect inequality."
Apply it to territories rather than to people. Take each territory's total addressable value, compute the Gini across them, and you have a single number describing how fairly you have divided the opportunity.
Our simulated figures give you a scale. Random allocation produced a territory Gini of about 0.13. The snake draft produced about 0.04. Those are small-looking numbers attached to a 2.0 times gap and a 1.24 times gap respectively, which is a good reason to publish the ratio alongside the coefficient rather than the coefficient alone.
Then set a threshold and hold to it. Something like: no territory more than 20 percent above or below the mean, checked at every reallocation. A rule you can fail is worth more than a principle you cannot.
And publish it next to quota attainment. If your territories vary by 2 times and your reps' attainment varies by 30 percent, the attainment differences are inside the noise your allocation created, and any conclusion drawn from them is about the draw. Our note on SDR compensation plans covers what that means for paying people fairly.
Value is not the only axis, but it is the one people skip
Workload is a separate constraint from value. A territory of forty small accounts and a territory of eight large ones can be worth the same and require completely different amounts of time. Balance both or state explicitly which one you are optimising.
Existing relationships beat marginal balance. A rep who has worked an account for two years carries knowledge that will not transfer in a handover. Moving that account to make a spreadsheet symmetrical usually costs more than the imbalance did.
Travel and time zones are real constraints in the territories where they apply. Which is fewer territories than it used to be, and worth checking rather than assuming.
Language and regulatory coverage are hard constraints, not preferences. Do these first, as exclusions, then balance value within what remains. Trying to optimise everything simultaneously produces a model nobody can explain to the people it affects.
Do it in that order and the process is defensible. Hard constraints, then relationships, then value balance, then workload. Every step you can justify out loud is a step you will not have to renegotiate in January.
[SCREENSHOT NEEDED: a CRM territory view showing account owner alongside account value, with the totals per owner visible]
Reallocation, which is the part that actually hurts
Reallocate on a schedule, not on a complaint. An annual cycle announced in advance is absorbed. A mid-year change made because someone escalated teaches everyone that escalating works.
Protect open opportunities through their close. Moving an account with a live deal in it destroys value for everyone including the customer. Let it close, then transfer.
Say what happens to commission on in-flight deals before you move anything. This is the single most predictable source of disputes and it takes one paragraph to prevent.
Do not reallocate to punish or reward. Territory is the input to performance, not an output of it. Using it as a reward makes next year's attainment data uninterpretable and everybody knows it.
Tell people the method, not just the outcome. A rep who understands that accounts were dealt in a value-ranked snake draft will argue with the inputs. A rep who is handed a list will assume politics, and will often be right.
Your CRM should hold the allocation, not a spreadsheet. Pipedrive and every comparable system supports owner-level views and reporting, which is what makes the balance checkable at any time rather than at the moment you built it. Our Pipedrive review covers the tool itself.
Two reasons the method now has to be written down
Territory determines earnings, which makes it a contractual question. In the UK, the Acas guidance on changing an employment contract is that "You must both agree to the changes. This is unless there's a clause in the contract that allows you to make a change without agreement", and that imposing a change without proper consultation risks "legal claims, for example claims of breach of contract or constructive dismissal". Whether a territory move is a contract change depends on your contracts, which is a question worth answering once rather than during a dispute.
And an unexplainable allocation is now a reporting problem as well as a fairness one. Under the EU pay transparency directive, the European Commission's summary states that employers "with at least 100 employees" must "publish information on the pay gap between female and male workers", and must "carry out a pay assessment if pay reports reveal a gender pay gap of at least 5% that cannot be justified."
Read the phrase "that cannot be justified" as an instruction about documentation. Commission is pay. If territory value is allocated in a way that happens to correlate with who works where, the earnings difference lands in a figure you now have to publish and account for. A documented, value-ranked allocation is a justification. A spreadsheet nobody can explain is the opposite of one.
Which is the same conclusion the fairness argument reaches by a different road. Write down the method, apply it consistently, keep the working. This is not legal advice and both positions vary by jurisdiction and by your own contracts.
What we do not publish here
A recommended number of accounts per rep. It depends on deal size, cycle length and how much of the work is account management rather than acquisition, none of which we know about you.
Quota attainment or territory value benchmarks. Ours come from a specific set of clients and markets.
A claim that balanced territories improve performance. We have not run a controlled test, and a fair allocation is defensible on its own terms whether or not it raises the aggregate number.
Any specific distribution as typical of B2B. The simulation uses a plausible skew and the article says so. Run it on your own data rather than adopting our shape.
A recommendation between territory models by industry. The constraints differ too much and the honest answer is the ordered process above rather than a template.
FAQ
How should you divide sales territories fairly?
Apply hard constraints first, such as language and regulatory coverage, then preserve existing relationships, then balance the remaining accounts by value using a snake draft or greedy assignment rather than by geography or alphabet, then check workload. Measure the result and publish it.
Why do random or geographic territory splits go wrong?
Because account value is heavily concentrated and geography is random with respect to value. In our simulation of 250 accounts across 5 territories, a value-blind split produced a median 2.0 times gap between the largest and smallest territory, rising to 3.0 times in the worst tenth of runs.
What is a snake draft for account allocation?
Rank accounts by value, deal one to each territory in order, then reverse the order for the next round so the territory that picked first picks last. In our simulation it cut the largest-to-smallest gap from about 2.0 times to about 1.24 times, for essentially no extra effort.
How do you measure whether territories are balanced?
Compute the Gini coefficient across territory totals, the same measure used for income inequality, where 0 is perfect equality. Publish it alongside the ratio between the largest and smallest territory, because the ratio is easier for people to interpret.
How often should you reallocate territories?
On an announced annual cycle rather than in response to complaints, protecting open opportunities through their close and stating the commission treatment for in-flight deals in advance.
Does territory balance actually improve results?
We have not tested that and we are not going to claim it. What we will claim is narrower: if territory value varies by more than performance varies, your performance data cannot separate the reps from the draw.
Bottom line
Sort your accounts by value and look at the concentration before you do anything else, because that single column explains why value-blind allocation fails. Then stop splitting by geography or alphabet, which are random with respect to value and produce a roughly two times gap between the best and worst territory at the sizes sales teams actually run. Deal the accounts in a value-ranked snake draft or assign greedily to the smallest territory, which costs an afternoon and removes most of the inequality. Measure what you built with a Gini coefficient and publish it beside quota attainment, so that everyone can see whether the performance spread is bigger or smaller than the spread you handed out. And when you reallocate, do it on a schedule, protect the open deals, and explain the method rather than the outcome.
Want the pipeline built rather than the territories redrawn? Book a call with GROU. We run lead generation and outbound inside B2B revenue engines across verticals.
We are GROU, a B2B pipeline agency that runs lead generation, outbound, and LinkedIn content for clients across manufacturing, fintech, iGaming, software, and professional services. Some links in this article are affiliate links, including Pipedrive. The allocation figures are our own simulation, with the method and inputs stated so you can reproduce them on your own data.
Split your accounts between five reps at random and the biggest territory will be worth about twice the smallest. Not because anyone did anything wrong. Because account value is skewed, and skew does not average out at the sizes a sales team actually works with.
Which means the gap between your best and worst performer may be a gap in the draw rather than a gap in the people. Nobody checks, because almost nobody measures how unequal their territories are.
TL;DR
B2B account value is heavily concentrated, so any allocation that ignores value produces territories of very different worth. In our simulation of 250 accounts across 5 territories, drawn from a realistically skewed distribution where the top 20 percent of accounts hold about 72 percent of the value, a random split gave a median 2.0 times gap between the largest and smallest territory, and in the worst tenth of splits a 3.0 times gap. Geography and alphabet are random with respect to value, so they produce the same result. Two fixes remove most of it: deal accounts out in a snake draft ordered by value, which cut the gap to about 1.2 times, or greedily assign each account to the currently smallest territory, which closed it almost entirely. Then measure what you have built, using the same coefficient economists use for income inequality, and publish the number alongside quota attainment, because attainment differences smaller than your territory inequality are not telling you anything about your reps.
Why any value-blind split fails
Start with the distribution, because everything follows from it. In B2B, a minority of accounts holds most of the addressable value. In the simulation underpinning this article, the top 20 percent of accounts held roughly 72 percent of the total, which gives an account-level Gini coefficient of about 0.69. That is a more unequal distribution than the income of any country on earth.
Now split that at random and watch what happens. With a distribution that skewed, whichever territory happens to receive two of the largest accounts is worth far more than the one that receives none, and no amount of equalising the account count fixes it, because the count was never the thing that varied.
Geography and alphabet are random with respect to value. This is the part that surprises people. Splitting by region or by first letter feels principled and is, statistically, a random draw as far as value is concerned, so it produces exactly the same inequality as drawing names from a hat.
And it does not average out at the sizes you work with. Averaging rescues you when the numbers are large and the distribution is not too skewed. A sales team has five or ten territories and a heavy tail, which is precisely the case where it does not.
How unequal, exactly
Random or value-blind allocation. Across 400 simulated runs of 250 accounts into 5 territories, the median ratio between the largest and smallest territory was 2.0 times. In the worst tenth of runs it reached 3.0 times.
A snake draft ordered by value. Rank every account by value, then deal them out one to each territory and back again, so the territory that took the largest account takes the last pick in the next round. That cut the median gap to about 1.24 times.
Greedy balancing. Sort accounts by value, then assign each one in turn to whichever territory currently has the least. In the simulation this closed the gap almost completely, to about 1.0 times.
The pattern holds at other sizes. With 500 accounts across 5 territories a random split still gave a median 1.64 times gap. With 120 accounts across 4 territories it gave 2.09 times. Smaller books are worse, which is the opposite of the intuition that a small team is simpler to balance.
Run it on your own numbers before you believe ours. The distribution shape matters, and yours will not be identical. The method is the point: simulate the split you are about to make, several hundred times, and look at the spread before you commit anyone's year to it.
[SCREENSHOT NEEDED: a spreadsheet showing account value sorted descending with the cumulative percentage column, to reveal the concentration]
Measure the inequality you have built
Borrow the tool economists use. The World Bank defines the Gini index as measuring "the extent to which the distribution of income (or, in some cases, consumption expenditure) among individuals or households within an economy deviates from a perfectly equal distribution", where "a Gini index of 0 represents perfect equality, while an index of 100 implies perfect inequality."
Apply it to territories rather than to people. Take each territory's total addressable value, compute the Gini across them, and you have a single number describing how fairly you have divided the opportunity.
Our simulated figures give you a scale. Random allocation produced a territory Gini of about 0.13. The snake draft produced about 0.04. Those are small-looking numbers attached to a 2.0 times gap and a 1.24 times gap respectively, which is a good reason to publish the ratio alongside the coefficient rather than the coefficient alone.
Then set a threshold and hold to it. Something like: no territory more than 20 percent above or below the mean, checked at every reallocation. A rule you can fail is worth more than a principle you cannot.
And publish it next to quota attainment. If your territories vary by 2 times and your reps' attainment varies by 30 percent, the attainment differences are inside the noise your allocation created, and any conclusion drawn from them is about the draw. Our note on SDR compensation plans covers what that means for paying people fairly.
Value is not the only axis, but it is the one people skip
Workload is a separate constraint from value. A territory of forty small accounts and a territory of eight large ones can be worth the same and require completely different amounts of time. Balance both or state explicitly which one you are optimising.
Existing relationships beat marginal balance. A rep who has worked an account for two years carries knowledge that will not transfer in a handover. Moving that account to make a spreadsheet symmetrical usually costs more than the imbalance did.
Travel and time zones are real constraints in the territories where they apply. Which is fewer territories than it used to be, and worth checking rather than assuming.
Language and regulatory coverage are hard constraints, not preferences. Do these first, as exclusions, then balance value within what remains. Trying to optimise everything simultaneously produces a model nobody can explain to the people it affects.
Do it in that order and the process is defensible. Hard constraints, then relationships, then value balance, then workload. Every step you can justify out loud is a step you will not have to renegotiate in January.
[SCREENSHOT NEEDED: a CRM territory view showing account owner alongside account value, with the totals per owner visible]
Reallocation, which is the part that actually hurts
Reallocate on a schedule, not on a complaint. An annual cycle announced in advance is absorbed. A mid-year change made because someone escalated teaches everyone that escalating works.
Protect open opportunities through their close. Moving an account with a live deal in it destroys value for everyone including the customer. Let it close, then transfer.
Say what happens to commission on in-flight deals before you move anything. This is the single most predictable source of disputes and it takes one paragraph to prevent.
Do not reallocate to punish or reward. Territory is the input to performance, not an output of it. Using it as a reward makes next year's attainment data uninterpretable and everybody knows it.
Tell people the method, not just the outcome. A rep who understands that accounts were dealt in a value-ranked snake draft will argue with the inputs. A rep who is handed a list will assume politics, and will often be right.
Your CRM should hold the allocation, not a spreadsheet. Pipedrive and every comparable system supports owner-level views and reporting, which is what makes the balance checkable at any time rather than at the moment you built it. Our Pipedrive review covers the tool itself.
Two reasons the method now has to be written down
Territory determines earnings, which makes it a contractual question. In the UK, the Acas guidance on changing an employment contract is that "You must both agree to the changes. This is unless there's a clause in the contract that allows you to make a change without agreement", and that imposing a change without proper consultation risks "legal claims, for example claims of breach of contract or constructive dismissal". Whether a territory move is a contract change depends on your contracts, which is a question worth answering once rather than during a dispute.
And an unexplainable allocation is now a reporting problem as well as a fairness one. Under the EU pay transparency directive, the European Commission's summary states that employers "with at least 100 employees" must "publish information on the pay gap between female and male workers", and must "carry out a pay assessment if pay reports reveal a gender pay gap of at least 5% that cannot be justified."
Read the phrase "that cannot be justified" as an instruction about documentation. Commission is pay. If territory value is allocated in a way that happens to correlate with who works where, the earnings difference lands in a figure you now have to publish and account for. A documented, value-ranked allocation is a justification. A spreadsheet nobody can explain is the opposite of one.
Which is the same conclusion the fairness argument reaches by a different road. Write down the method, apply it consistently, keep the working. This is not legal advice and both positions vary by jurisdiction and by your own contracts.
What we do not publish here
A recommended number of accounts per rep. It depends on deal size, cycle length and how much of the work is account management rather than acquisition, none of which we know about you.
Quota attainment or territory value benchmarks. Ours come from a specific set of clients and markets.
A claim that balanced territories improve performance. We have not run a controlled test, and a fair allocation is defensible on its own terms whether or not it raises the aggregate number.
Any specific distribution as typical of B2B. The simulation uses a plausible skew and the article says so. Run it on your own data rather than adopting our shape.
A recommendation between territory models by industry. The constraints differ too much and the honest answer is the ordered process above rather than a template.
FAQ
How should you divide sales territories fairly?
Apply hard constraints first, such as language and regulatory coverage, then preserve existing relationships, then balance the remaining accounts by value using a snake draft or greedy assignment rather than by geography or alphabet, then check workload. Measure the result and publish it.
Why do random or geographic territory splits go wrong?
Because account value is heavily concentrated and geography is random with respect to value. In our simulation of 250 accounts across 5 territories, a value-blind split produced a median 2.0 times gap between the largest and smallest territory, rising to 3.0 times in the worst tenth of runs.
What is a snake draft for account allocation?
Rank accounts by value, deal one to each territory in order, then reverse the order for the next round so the territory that picked first picks last. In our simulation it cut the largest-to-smallest gap from about 2.0 times to about 1.24 times, for essentially no extra effort.
How do you measure whether territories are balanced?
Compute the Gini coefficient across territory totals, the same measure used for income inequality, where 0 is perfect equality. Publish it alongside the ratio between the largest and smallest territory, because the ratio is easier for people to interpret.
How often should you reallocate territories?
On an announced annual cycle rather than in response to complaints, protecting open opportunities through their close and stating the commission treatment for in-flight deals in advance.
Does territory balance actually improve results?
We have not tested that and we are not going to claim it. What we will claim is narrower: if territory value varies by more than performance varies, your performance data cannot separate the reps from the draw.
Bottom line
Sort your accounts by value and look at the concentration before you do anything else, because that single column explains why value-blind allocation fails. Then stop splitting by geography or alphabet, which are random with respect to value and produce a roughly two times gap between the best and worst territory at the sizes sales teams actually run. Deal the accounts in a value-ranked snake draft or assign greedily to the smallest territory, which costs an afternoon and removes most of the inequality. Measure what you built with a Gini coefficient and publish it beside quota attainment, so that everyone can see whether the performance spread is bigger or smaller than the spread you handed out. And when you reallocate, do it on a schedule, protect the open deals, and explain the method rather than the outcome.
Want the pipeline built rather than the territories redrawn? Book a call with GROU. We run lead generation and outbound inside B2B revenue engines across verticals.
We are GROU, a B2B pipeline agency that runs lead generation, outbound, and LinkedIn content for clients across manufacturing, fintech, iGaming, software, and professional services. Some links in this article are affiliate links, including Pipedrive. The allocation figures are our own simulation, with the method and inputs stated so you can reproduce them on your own data.

Pipeline OS Newsletter
Build qualified pipeline
Get weekly tactics to generate demand, improve lead quality, and book more meetings.







Trusted by industry leaders
Trusted by industry leaders
Trusted by industry leaders
Ready to build qualified pipeline?
Ready to build qualified pipeline?
Ready to build qualified pipeline?
Book a call to see if we're the right fit, or take the 2-minute quiz to get a clear starting point.
Book a call to see if we're the right fit, or take the 2-minute quiz to get a clear starting point.
Book a call to see if we're the right fit, or take the 2-minute quiz to get a clear starting point.
" height="30.21639343089746px" id="hfGbXmQR2" width="30.216393430897455px"/></svg>)
Copyright © 2026 – All Right Reserved
Copyright © 2026 – All Right Reserved
Copyright © 2026 – All Right Reserved