%22%3E%3C/path%3E%3Cpath d=%22M 63.072 7.554 C 62.258 8.022 61.577 8.689 61.092 9.493 L 61.092 7.076 L 57.158 7.076 L 57.158 22.64 L 61.089 22.64 L 61.089 14.888 C 61.089 13.446 61.403 12.434 62.03 11.853 C 62.818 11.218 63.818 10.907 64.826 10.982 L 65.868 10.982 L 65.868 6.851 C 64.891 6.834 63.926 7.076 63.073 7.554 Z%22 fill=%22rgb(17,17,17)%22%3E%3C/path%3E%3Cpath d=%22M 78.916 7.82 C 76.363 6.49 73.321 6.49 70.768 7.82 C 69.562 8.473 68.564 9.451 67.888 10.644 C 67.167 11.931 66.803 13.387 66.834 14.862 C 66.804 16.332 67.157 17.785 67.86 19.077 C 68.515 20.267 69.494 21.246 70.684 21.901 C 71.924 22.576 73.318 22.92 74.73 22.898 C 76.164 22.918 77.58 22.575 78.846 21.901 C 80.062 21.247 81.073 20.27 81.768 19.077 C 82.506 17.797 82.88 16.339 82.85 14.862 C 82.88 13.389 82.517 11.934 81.797 10.647 C 81.12 9.455 80.122 8.477 78.917 7.824 M 78.803 14.862 C 78.829 15.739 78.636 16.608 78.241 17.391 C 77.903 18.046 77.38 18.588 76.738 18.95 C 76.124 19.293 75.432 19.472 74.729 19.47 C 73.668 19.497 72.648 19.061 71.934 18.276 C 71.139 17.323 70.741 16.1 70.823 14.862 C 70.741 13.62 71.149 12.395 71.959 11.45 C 72.687 10.667 73.715 10.233 74.783 10.256 C 75.859 10.236 76.894 10.67 77.635 11.45 C 78.464 12.387 78.884 13.616 78.801 14.864%22 fill=%22rgb(17,17,17)%22%3E%3C/path%3E%3Cpath d=%22M 95.906 7.076 L 95.906 15.646 C 95.975 16.68 95.643 17.701 94.979 18.498 C 94.311 19.184 93.379 19.547 92.422 19.495 C 91.475 19.544 90.553 19.18 89.894 18.498 C 89.23 17.701 88.898 16.68 88.967 15.646 L 88.967 7.076 L 85.033 7.076 L 85.033 16.207 C 85 17.449 85.275 18.68 85.834 19.79 C 86.327 20.75 87.095 21.542 88.039 22.065 C 89.033 22.594 90.145 22.861 91.271 22.838 C 92.188 22.847 93.095 22.65 93.926 22.263 C 94.708 21.905 95.388 21.36 95.906 20.675 L 95.906 22.645 L 99.865 22.645 L 99.865 7.076 Z%22 fill=%22rgb(17,17,17)%22%3E%3C/path%3E%3Cpath d=%22M 4.513 15.626 C 4.511 10.815 7.606 6.549 12.181 5.059 C 16.756 3.57 21.77 5.195 24.601 9.086 L 27.816 5.87 C 24.074 1.186 17.981 -0.943 12.137 0.393 C 6.292 1.728 1.728 6.292 0.393 12.137 C -0.943 17.981 1.186 24.074 5.87 27.816 L 9.085 24.601 C 6.214 22.512 4.515 19.177 4.513 15.626%22 fill=%22rgb(32,62,235)%22%3E%3C/path%3E%3Cpath d=%22M 17.114 14.343 L 13.354 18.01 L 13.354 18.026 L 21.071 18.026 L 11.412 27.609 L 17.389 27.609 L 23.999 21.081 L 23.999 28.316 L 24.005 28.316 L 27.967 24.393 L 27.967 14.343 Z%22 fill=%22rgb(32,62,235)%22%3E%3C/path%3E%3C/g%3E%3C/svg%3E) ×
× ××
××›
›
›
›
Similarweb review 2026
Similarweb review 2026
Similarweb review 2026
Similarweb review 2026
Similarweb review 2026
Similarweb review 2026

Author
Aljaz Peklaj

The most useful things you can learn about Similarweb are in its own documentation, and they are more candid than any review.
Similarweb states that it is an estimations tool, that it does not expect its figures to match your direct measurement, that its estimates are less accurate for sites under 100,000 monthly visits, and that it will not display data at all for a site whose last snapshot showed fewer than 5,000 monthly visits. For a B2B team, those two thresholds decide whether the product is worth anything to you before any feature comparison begins.
TL;DR
Similarweb builds its picture from four named sources: first-party analytics from website and app owners, an anonymous contributors network from products installed on millions of devices, publicly available data, and partnerships with providers including ISPs and measurement companies. It claims 10 billion digital signals collected daily and over 200 data scientists. The product is genuinely strong on large consumer properties and market-level questions. Where it stops being useful is the small end, and Similarweb publishes the thresholds itself: no data displays below roughly 5,000 monthly visits, and accuracy degrades below 100,000. It also states plainly that "Because we are an estimations tool...we don't expect our estimations to align exactly with your direct measurement data", that it expects trend alignment rather than exact alignment, and that "even when comparing data for the same site from different direct measurement tools, the variance can be up to 30%". Pricing is not published on the page: the meta description states it begins at $125 a month while the table itself did not render for us, and the page routes to sales. Buy it for market and competitor questions at scale, not for checking whether a mid-market prospect is growing.
What it actually measures
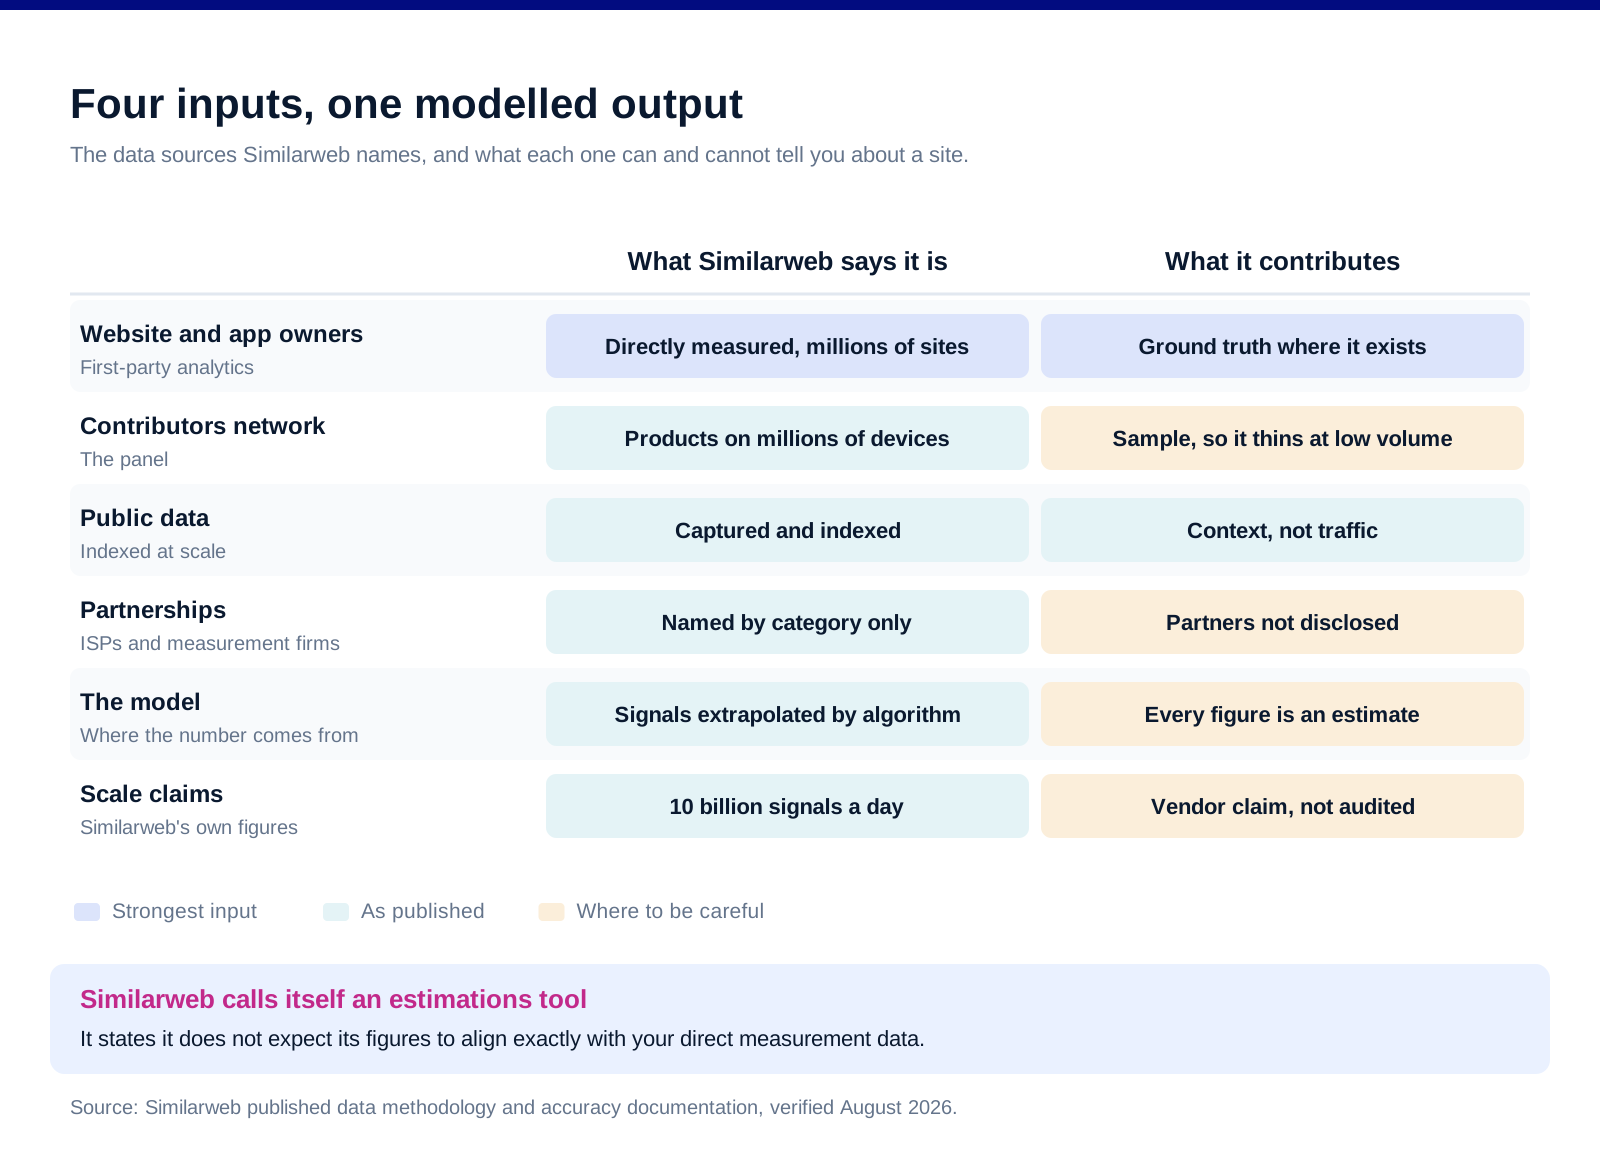
Four named inputs, not one. Similarweb's data page lists website and app owner data "directly measured through first party analytics (e.g. Google Analytics) of millions of websites and apps", a contributors network of "Anonymous traffic data collected from Similarweb products installed on millions of devices, worldwide", public data "algorithmically captured and indexed from millions of websites and apps", and partnerships with "DPSs, ISPs, measurement companies and corporate intelligence firms".
The scale claims are Similarweb's own. It states 10 billion digital signals collected daily, 2TB of data analysed daily, over 200 data scientists and more than 10,000 traffic reports generated daily. Those are vendor figures about the vendor's own operation and we publish them as such.
Everything downstream is modelled. Similarweb describes extrapolating those signals into a picture of online activity using algorithms. That is the correct way to build this product and it is also the reason every number it produces is an estimate rather than a measurement.
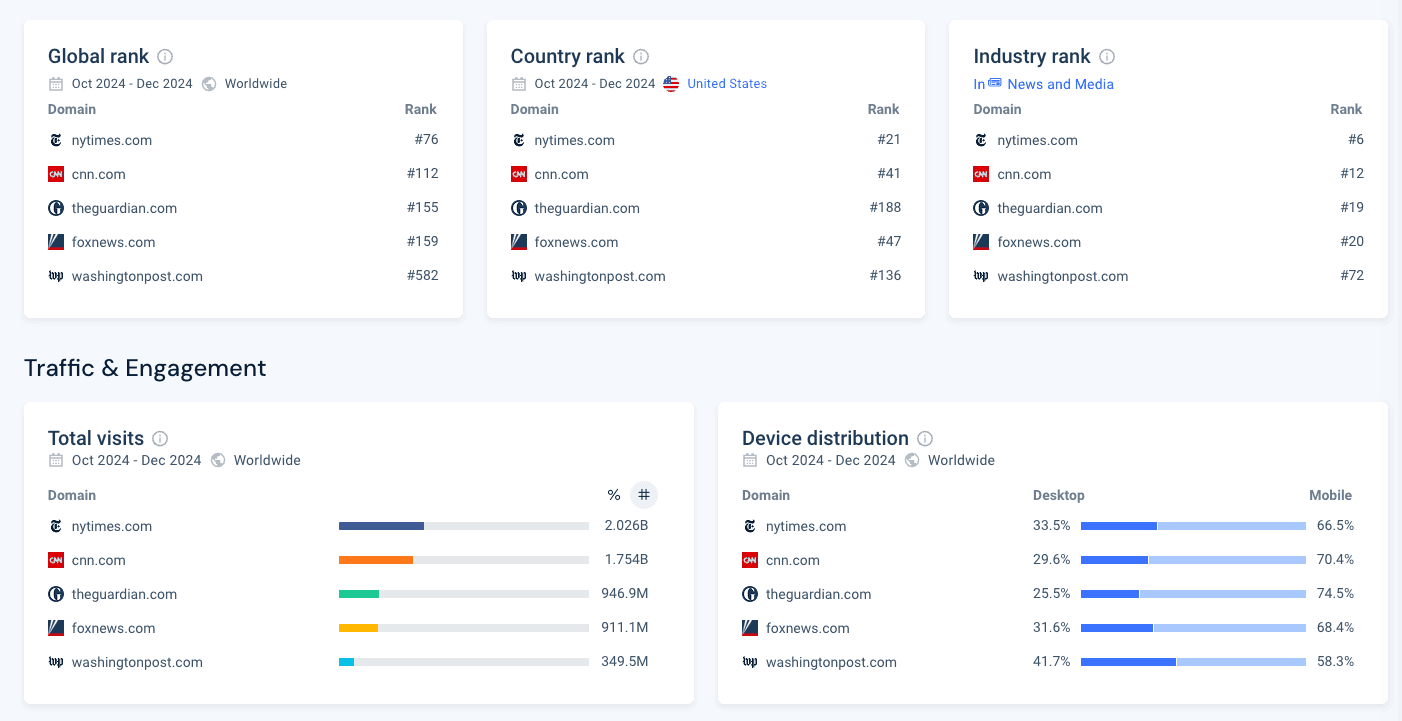
Which the company says clearly. Its accuracy documentation states "Because we are an estimations tool...we don't expect our estimations to align exactly with your direct measurement data", and describes the goal as trend alignment.
And it cites an outside study rather than its own. Similarweb points to a SparkToro study finding its estimates closest to users' Google Analytics data among the tools compared, with particular strength between 5,000 and 100,000 monthly Google Analytics users. We have not read that study and we are reporting only that Similarweb cites it.
The two thresholds that decide this for B2B
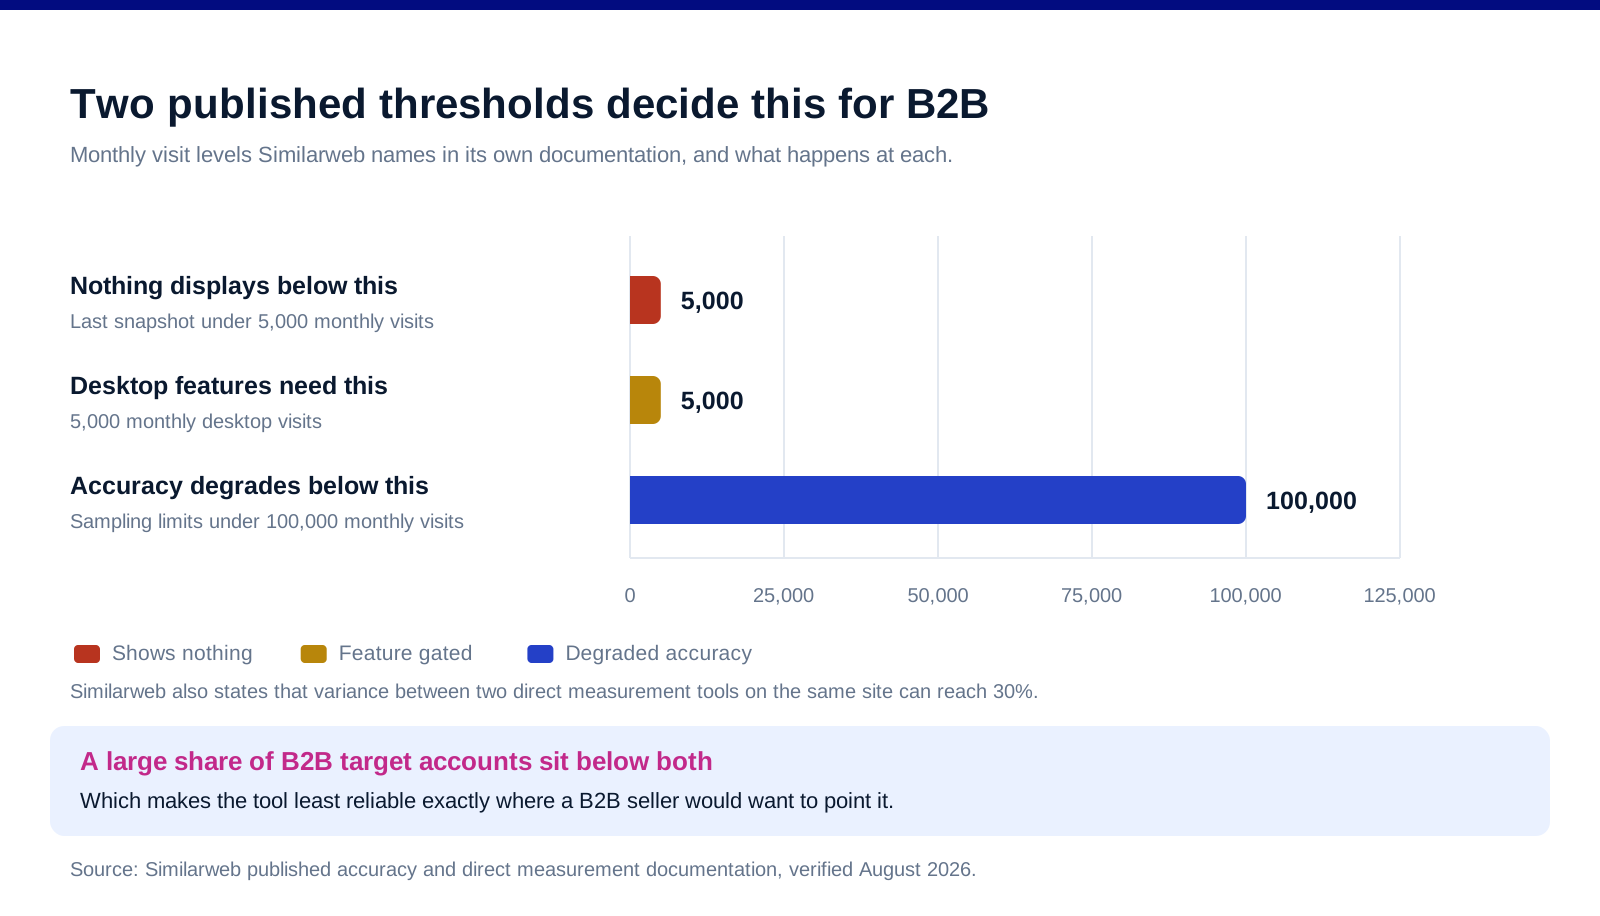
Below about 5,000 monthly visits, you see nothing. Similarweb's documentation states that data will not display if a site's last snapshot showed fewer than 5,000 monthly visits, and that some desktop-specific features require at least 5,000 monthly desktop visits.
Below 100,000 monthly visits, accuracy degrades. Its comparison documentation states that because Similarweb uses sampling, "estimations are less accurate for sites under 100K monthly visits".
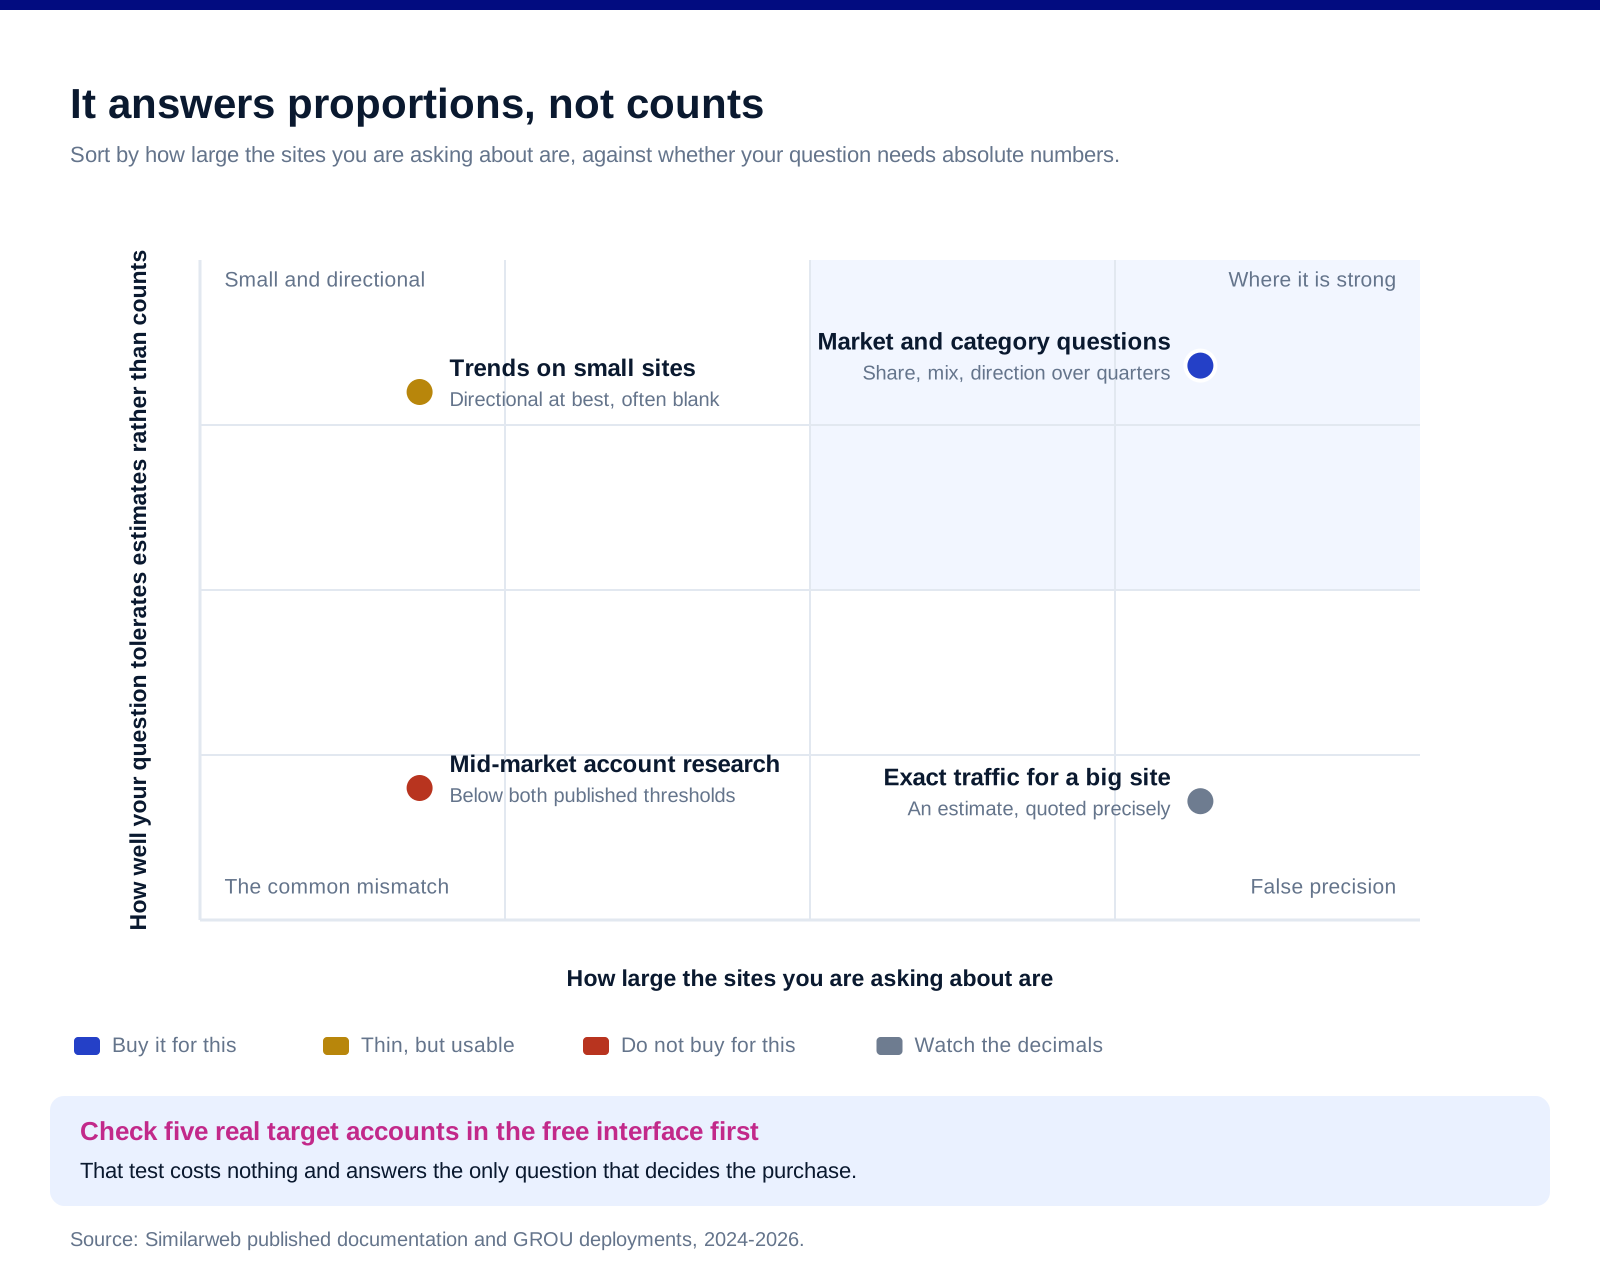
Those two numbers are the review. A large share of B2B target accounts sit below both, which means the tool is least reliable precisely where a B2B seller would want to point it.
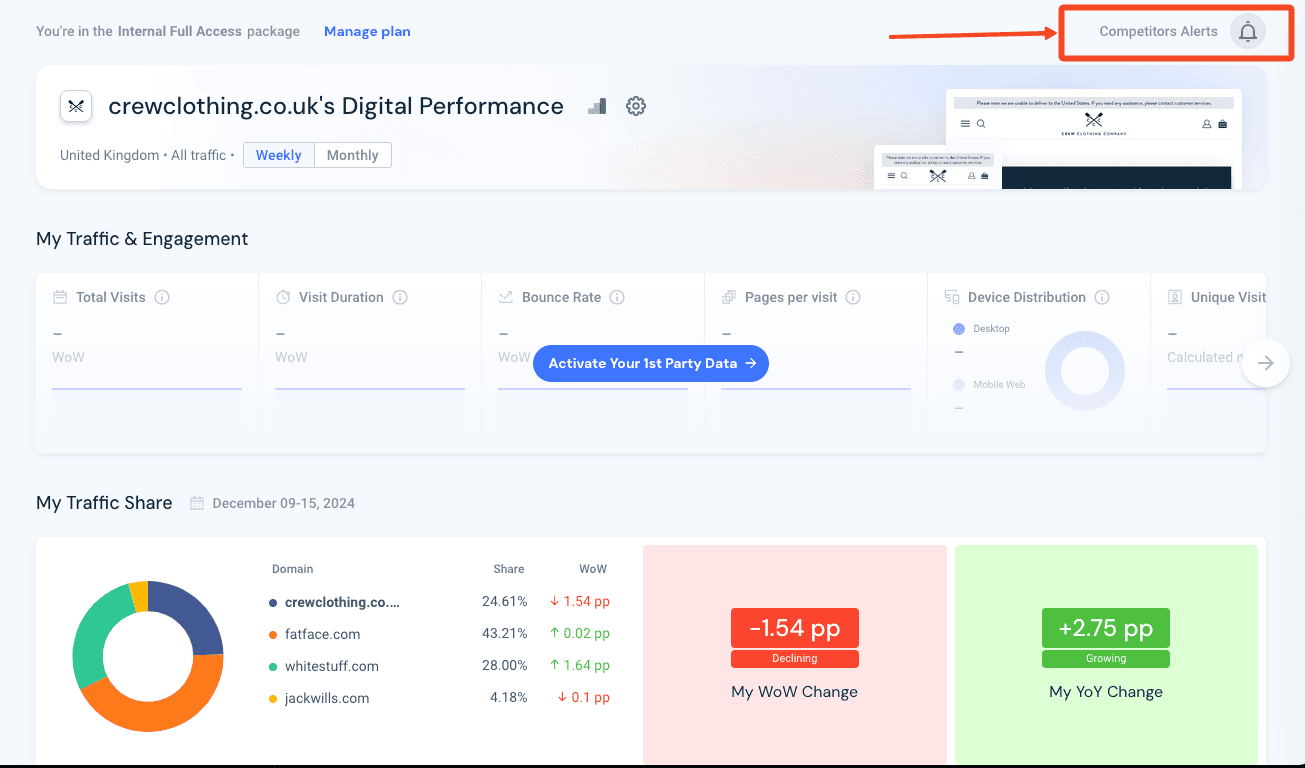
It is not a criticism of the method. Sampling degrades at small volumes in every product built this way. It is a criticism of using the tool for account-level research on mid-market companies, which is what a lot of B2B teams buy it for.
The variance guidance is worth internalising too. Similarweb notes that "even when comparing data for the same site from different direct measurement tools, the variance can be up to 30%", and that "There isn't a single source of truth". Read that before you build a report where a competitor's traffic figure carries a decimal place.
Where it earns its price
Market and category questions. Share of traffic across a set of competitors, channel mix at category level, and how a market is shifting over quarters. These are the questions estimation is good at, because trend direction survives sampling error better than absolute numbers do.
Large consumer and marketplace properties. Well above both thresholds, with enough signal that the estimates behave.
Competitor channel mix. Knowing that a competitor's traffic is mostly paid, or mostly direct, is a strategic fact that does not need three significant figures to be useful.
Audience overlap and geography. Useful for market entry decisions, and again a question about proportions rather than absolute counts.
![Similarweb, a competitive analysis view comparing traffic share across several domains in one category]](https://framerusercontent.com/images/4lBLpgw0K5PjcxRaTAwVDlcTI.png)
Not account research on mid-market prospects. This is the mismatch that produces disappointed B2B buyers, and the thresholds above explain it entirely.
And not a substitute for your own analytics. Similarweb itself recommends connecting Google Analytics to address discrepancies, which is a sensible instruction and also an admission of what the estimates are for.
What it costs, and what that tells you
The price is not on the pricing page. Similarweb's pricing page routes to sales. Its meta description states that pricing begins at $125 a month, while the pricing table itself did not render for us, so we publish no tier prices.
That is a choice with a cost. Nielsen Norman Group's research on business buyers found that "participants go to competitors' sites when websites do not show prices" and that "People view companies that hide costs as being evasive and untrustworthy". Our pricing page piece covers the general case.
Practically, it means you cannot budget this without a call. Which is fine for an enterprise procurement process and a genuine obstacle for a team trying to work out whether the tool clears its own thresholds for their use case.
Ask two questions on that call. What the entry package actually includes, and whether the accounts you care about are above the display threshold. The second one is answerable in the free web interface before you speak to anyone.
And check the free tier first. The public website checker will tell you within minutes whether your target accounts return data at all, which is the cheapest possible qualification of this purchase.
What Similarweb does not publish
Tier prices on the pricing page. Routed to sales, with a starting figure appearing only in the page metadata.
A stated accuracy percentage. It cites a third-party study rather than publishing its own accuracy metric, and it explicitly frames the goal as trend alignment rather than precision.
The size of the contributors network. Described as millions of devices, without a figure.
Which partners contribute data. Named by category, including ISPs and measurement companies, without naming the organisations.
How the estimate changes when a site connects its own analytics. The recommendation exists; the effect on the public estimate is not described.
FAQ
How accurate is Similarweb?
Similarweb states that it is an estimations tool and does not expect its figures to align exactly with your direct measurement data, aiming instead for trend alignment. It also states that estimates are less accurate for sites under 100,000 monthly visits, and that data will not display for sites whose last snapshot showed fewer than 5,000 monthly visits. It cites a third-party SparkToro study rather than publishing an accuracy percentage of its own.
Why does Similarweb not match Google Analytics?
Because they measure differently and one of them is estimating. Similarweb names four reasons: different methodologies for calculating sessions and other metrics, inconsistent tracking implementation across a company's properties, sampling limits at low volumes, and mismatched comparison parameters such as timeframe or device. It also notes that variance between two direct measurement tools on the same site can reach 30%.
Is Similarweb good for B2B?
For market and competitor questions at category level, yes. For account research on individual mid-market prospects, usually not, because a large share of those sites fall below the 100,000 monthly visit accuracy threshold and many fall below the 5,000 visit display floor. Check a handful of your real target accounts in the free web interface before buying.
How much does Similarweb cost?
Not published in a usable form. The pricing page routes to sales, and while its meta description states pricing begins at $125 a month, the pricing table did not render for us, so we publish no tier figures. Expect to need a sales conversation to get a number, and go into it knowing whether your target accounts clear the display threshold.
What data sources does Similarweb use?
Four, by its own account: first-party analytics data from website and app owners, an anonymous contributors network from Similarweb products installed on millions of devices, publicly available data captured and indexed algorithmically, and partnerships with providers including ISPs, measurement companies and corporate intelligence firms. Everything published is modelled from those inputs.
Should you use Similarweb or your own analytics?
Both, for different questions. Your own analytics is the only measurement of your own site. Similarweb is for questions about sites you do not own, and Similarweb itself recommends connecting Google Analytics to reconcile discrepancies. Treat its numbers as directional and its trends as the useful output.
Bottom line
Judge this one on two published thresholds rather than on the feature list. Nothing displays below roughly 5,000 monthly visits and accuracy degrades below 100,000, which together decide whether the tool can see the companies you actually care about. If your questions are about markets, categories and large properties, it is a strong product and the estimation method is the right one for the job. If your questions are about whether a specific mid-market prospect is growing, the tool will either show you nothing or show you a number Similarweb's own documentation tells you not to treat as precise. Check five real target accounts in the free interface before you book the sales call, because that test costs nothing and answers the only question that matters.
Want the pipeline built rather than the competitor dashboard read? Book a call with GROU. We run lead generation and outbound inside B2B revenue engines across verticals. If you are shopping rather than buying, our Similarweb alternatives piece covers the options and our Semrush alternatives piece covers the SEO toolkits.
We are GROU, a B2B pipeline agency that runs lead generation, outbound, and LinkedIn content for clients across manufacturing, fintech, iGaming, software, and professional services. Some links in this article are affiliate links, including Similarweb. Every claim about the methodology and its thresholds comes from Similarweb's own published documentation, and the review tells a large share of B2B readers to test before buying.
The most useful things you can learn about Similarweb are in its own documentation, and they are more candid than any review.
Similarweb states that it is an estimations tool, that it does not expect its figures to match your direct measurement, that its estimates are less accurate for sites under 100,000 monthly visits, and that it will not display data at all for a site whose last snapshot showed fewer than 5,000 monthly visits. For a B2B team, those two thresholds decide whether the product is worth anything to you before any feature comparison begins.
TL;DR
Similarweb builds its picture from four named sources: first-party analytics from website and app owners, an anonymous contributors network from products installed on millions of devices, publicly available data, and partnerships with providers including ISPs and measurement companies. It claims 10 billion digital signals collected daily and over 200 data scientists. The product is genuinely strong on large consumer properties and market-level questions. Where it stops being useful is the small end, and Similarweb publishes the thresholds itself: no data displays below roughly 5,000 monthly visits, and accuracy degrades below 100,000. It also states plainly that "Because we are an estimations tool...we don't expect our estimations to align exactly with your direct measurement data", that it expects trend alignment rather than exact alignment, and that "even when comparing data for the same site from different direct measurement tools, the variance can be up to 30%". Pricing is not published on the page: the meta description states it begins at $125 a month while the table itself did not render for us, and the page routes to sales. Buy it for market and competitor questions at scale, not for checking whether a mid-market prospect is growing.
What it actually measures
Four named inputs, not one. Similarweb's data page lists website and app owner data "directly measured through first party analytics (e.g. Google Analytics) of millions of websites and apps", a contributors network of "Anonymous traffic data collected from Similarweb products installed on millions of devices, worldwide", public data "algorithmically captured and indexed from millions of websites and apps", and partnerships with "DPSs, ISPs, measurement companies and corporate intelligence firms".
The scale claims are Similarweb's own. It states 10 billion digital signals collected daily, 2TB of data analysed daily, over 200 data scientists and more than 10,000 traffic reports generated daily. Those are vendor figures about the vendor's own operation and we publish them as such.
Everything downstream is modelled. Similarweb describes extrapolating those signals into a picture of online activity using algorithms. That is the correct way to build this product and it is also the reason every number it produces is an estimate rather than a measurement.
Which the company says clearly. Its accuracy documentation states "Because we are an estimations tool...we don't expect our estimations to align exactly with your direct measurement data", and describes the goal as trend alignment.
And it cites an outside study rather than its own. Similarweb points to a SparkToro study finding its estimates closest to users' Google Analytics data among the tools compared, with particular strength between 5,000 and 100,000 monthly Google Analytics users. We have not read that study and we are reporting only that Similarweb cites it.
The two thresholds that decide this for B2B
Below about 5,000 monthly visits, you see nothing. Similarweb's documentation states that data will not display if a site's last snapshot showed fewer than 5,000 monthly visits, and that some desktop-specific features require at least 5,000 monthly desktop visits.
Below 100,000 monthly visits, accuracy degrades. Its comparison documentation states that because Similarweb uses sampling, "estimations are less accurate for sites under 100K monthly visits".
Those two numbers are the review. A large share of B2B target accounts sit below both, which means the tool is least reliable precisely where a B2B seller would want to point it.
It is not a criticism of the method. Sampling degrades at small volumes in every product built this way. It is a criticism of using the tool for account-level research on mid-market companies, which is what a lot of B2B teams buy it for.
The variance guidance is worth internalising too. Similarweb notes that "even when comparing data for the same site from different direct measurement tools, the variance can be up to 30%", and that "There isn't a single source of truth". Read that before you build a report where a competitor's traffic figure carries a decimal place.
Where it earns its price
Market and category questions. Share of traffic across a set of competitors, channel mix at category level, and how a market is shifting over quarters. These are the questions estimation is good at, because trend direction survives sampling error better than absolute numbers do.
Large consumer and marketplace properties. Well above both thresholds, with enough signal that the estimates behave.
Competitor channel mix. Knowing that a competitor's traffic is mostly paid, or mostly direct, is a strategic fact that does not need three significant figures to be useful.
Audience overlap and geography. Useful for market entry decisions, and again a question about proportions rather than absolute counts.
Not account research on mid-market prospects. This is the mismatch that produces disappointed B2B buyers, and the thresholds above explain it entirely.
And not a substitute for your own analytics. Similarweb itself recommends connecting Google Analytics to address discrepancies, which is a sensible instruction and also an admission of what the estimates are for.
What it costs, and what that tells you
The price is not on the pricing page. Similarweb's pricing page routes to sales. Its meta description states that pricing begins at $125 a month, while the pricing table itself did not render for us, so we publish no tier prices.
That is a choice with a cost. Nielsen Norman Group's research on business buyers found that "participants go to competitors' sites when websites do not show prices" and that "People view companies that hide costs as being evasive and untrustworthy". Our pricing page piece covers the general case.
Practically, it means you cannot budget this without a call. Which is fine for an enterprise procurement process and a genuine obstacle for a team trying to work out whether the tool clears its own thresholds for their use case.
Ask two questions on that call. What the entry package actually includes, and whether the accounts you care about are above the display threshold. The second one is answerable in the free web interface before you speak to anyone.
And check the free tier first. The public website checker will tell you within minutes whether your target accounts return data at all, which is the cheapest possible qualification of this purchase.
What Similarweb does not publish
Tier prices on the pricing page. Routed to sales, with a starting figure appearing only in the page metadata.
A stated accuracy percentage. It cites a third-party study rather than publishing its own accuracy metric, and it explicitly frames the goal as trend alignment rather than precision.
The size of the contributors network. Described as millions of devices, without a figure.
Which partners contribute data. Named by category, including ISPs and measurement companies, without naming the organisations.
How the estimate changes when a site connects its own analytics. The recommendation exists; the effect on the public estimate is not described.
FAQ
How accurate is Similarweb?
Similarweb states that it is an estimations tool and does not expect its figures to align exactly with your direct measurement data, aiming instead for trend alignment. It also states that estimates are less accurate for sites under 100,000 monthly visits, and that data will not display for sites whose last snapshot showed fewer than 5,000 monthly visits. It cites a third-party SparkToro study rather than publishing an accuracy percentage of its own.
Why does Similarweb not match Google Analytics?
Because they measure differently and one of them is estimating. Similarweb names four reasons: different methodologies for calculating sessions and other metrics, inconsistent tracking implementation across a company's properties, sampling limits at low volumes, and mismatched comparison parameters such as timeframe or device. It also notes that variance between two direct measurement tools on the same site can reach 30%.
Is Similarweb good for B2B?
For market and competitor questions at category level, yes. For account research on individual mid-market prospects, usually not, because a large share of those sites fall below the 100,000 monthly visit accuracy threshold and many fall below the 5,000 visit display floor. Check a handful of your real target accounts in the free web interface before buying.
How much does Similarweb cost?
Not published in a usable form. The pricing page routes to sales, and while its meta description states pricing begins at $125 a month, the pricing table did not render for us, so we publish no tier figures. Expect to need a sales conversation to get a number, and go into it knowing whether your target accounts clear the display threshold.
What data sources does Similarweb use?
Four, by its own account: first-party analytics data from website and app owners, an anonymous contributors network from Similarweb products installed on millions of devices, publicly available data captured and indexed algorithmically, and partnerships with providers including ISPs, measurement companies and corporate intelligence firms. Everything published is modelled from those inputs.
Should you use Similarweb or your own analytics?
Both, for different questions. Your own analytics is the only measurement of your own site. Similarweb is for questions about sites you do not own, and Similarweb itself recommends connecting Google Analytics to reconcile discrepancies. Treat its numbers as directional and its trends as the useful output.
Bottom line
Judge this one on two published thresholds rather than on the feature list. Nothing displays below roughly 5,000 monthly visits and accuracy degrades below 100,000, which together decide whether the tool can see the companies you actually care about. If your questions are about markets, categories and large properties, it is a strong product and the estimation method is the right one for the job. If your questions are about whether a specific mid-market prospect is growing, the tool will either show you nothing or show you a number Similarweb's own documentation tells you not to treat as precise. Check five real target accounts in the free interface before you book the sales call, because that test costs nothing and answers the only question that matters.
Want the pipeline built rather than the competitor dashboard read? Book a call with GROU. We run lead generation and outbound inside B2B revenue engines across verticals. If you are shopping rather than buying, our Similarweb alternatives piece covers the options and our Semrush alternatives piece covers the SEO toolkits.
We are GROU, a B2B pipeline agency that runs lead generation, outbound, and LinkedIn content for clients across manufacturing, fintech, iGaming, software, and professional services. Some links in this article are affiliate links, including Similarweb. Every claim about the methodology and its thresholds comes from Similarweb's own published documentation, and the review tells a large share of B2B readers to test before buying.
The most useful things you can learn about Similarweb are in its own documentation, and they are more candid than any review.
Similarweb states that it is an estimations tool, that it does not expect its figures to match your direct measurement, that its estimates are less accurate for sites under 100,000 monthly visits, and that it will not display data at all for a site whose last snapshot showed fewer than 5,000 monthly visits. For a B2B team, those two thresholds decide whether the product is worth anything to you before any feature comparison begins.
TL;DR
Similarweb builds its picture from four named sources: first-party analytics from website and app owners, an anonymous contributors network from products installed on millions of devices, publicly available data, and partnerships with providers including ISPs and measurement companies. It claims 10 billion digital signals collected daily and over 200 data scientists. The product is genuinely strong on large consumer properties and market-level questions. Where it stops being useful is the small end, and Similarweb publishes the thresholds itself: no data displays below roughly 5,000 monthly visits, and accuracy degrades below 100,000. It also states plainly that "Because we are an estimations tool...we don't expect our estimations to align exactly with your direct measurement data", that it expects trend alignment rather than exact alignment, and that "even when comparing data for the same site from different direct measurement tools, the variance can be up to 30%". Pricing is not published on the page: the meta description states it begins at $125 a month while the table itself did not render for us, and the page routes to sales. Buy it for market and competitor questions at scale, not for checking whether a mid-market prospect is growing.
What it actually measures
Four named inputs, not one. Similarweb's data page lists website and app owner data "directly measured through first party analytics (e.g. Google Analytics) of millions of websites and apps", a contributors network of "Anonymous traffic data collected from Similarweb products installed on millions of devices, worldwide", public data "algorithmically captured and indexed from millions of websites and apps", and partnerships with "DPSs, ISPs, measurement companies and corporate intelligence firms".
The scale claims are Similarweb's own. It states 10 billion digital signals collected daily, 2TB of data analysed daily, over 200 data scientists and more than 10,000 traffic reports generated daily. Those are vendor figures about the vendor's own operation and we publish them as such.
Everything downstream is modelled. Similarweb describes extrapolating those signals into a picture of online activity using algorithms. That is the correct way to build this product and it is also the reason every number it produces is an estimate rather than a measurement.
Which the company says clearly. Its accuracy documentation states "Because we are an estimations tool...we don't expect our estimations to align exactly with your direct measurement data", and describes the goal as trend alignment.
And it cites an outside study rather than its own. Similarweb points to a SparkToro study finding its estimates closest to users' Google Analytics data among the tools compared, with particular strength between 5,000 and 100,000 monthly Google Analytics users. We have not read that study and we are reporting only that Similarweb cites it.
The two thresholds that decide this for B2B
Below about 5,000 monthly visits, you see nothing. Similarweb's documentation states that data will not display if a site's last snapshot showed fewer than 5,000 monthly visits, and that some desktop-specific features require at least 5,000 monthly desktop visits.
Below 100,000 monthly visits, accuracy degrades. Its comparison documentation states that because Similarweb uses sampling, "estimations are less accurate for sites under 100K monthly visits".
Those two numbers are the review. A large share of B2B target accounts sit below both, which means the tool is least reliable precisely where a B2B seller would want to point it.
It is not a criticism of the method. Sampling degrades at small volumes in every product built this way. It is a criticism of using the tool for account-level research on mid-market companies, which is what a lot of B2B teams buy it for.
The variance guidance is worth internalising too. Similarweb notes that "even when comparing data for the same site from different direct measurement tools, the variance can be up to 30%", and that "There isn't a single source of truth". Read that before you build a report where a competitor's traffic figure carries a decimal place.
Where it earns its price
Market and category questions. Share of traffic across a set of competitors, channel mix at category level, and how a market is shifting over quarters. These are the questions estimation is good at, because trend direction survives sampling error better than absolute numbers do.
Large consumer and marketplace properties. Well above both thresholds, with enough signal that the estimates behave.
Competitor channel mix. Knowing that a competitor's traffic is mostly paid, or mostly direct, is a strategic fact that does not need three significant figures to be useful.
Audience overlap and geography. Useful for market entry decisions, and again a question about proportions rather than absolute counts.
Not account research on mid-market prospects. This is the mismatch that produces disappointed B2B buyers, and the thresholds above explain it entirely.
And not a substitute for your own analytics. Similarweb itself recommends connecting Google Analytics to address discrepancies, which is a sensible instruction and also an admission of what the estimates are for.
What it costs, and what that tells you
The price is not on the pricing page. Similarweb's pricing page routes to sales. Its meta description states that pricing begins at $125 a month, while the pricing table itself did not render for us, so we publish no tier prices.
That is a choice with a cost. Nielsen Norman Group's research on business buyers found that "participants go to competitors' sites when websites do not show prices" and that "People view companies that hide costs as being evasive and untrustworthy". Our pricing page piece covers the general case.
Practically, it means you cannot budget this without a call. Which is fine for an enterprise procurement process and a genuine obstacle for a team trying to work out whether the tool clears its own thresholds for their use case.
Ask two questions on that call. What the entry package actually includes, and whether the accounts you care about are above the display threshold. The second one is answerable in the free web interface before you speak to anyone.
And check the free tier first. The public website checker will tell you within minutes whether your target accounts return data at all, which is the cheapest possible qualification of this purchase.
What Similarweb does not publish
Tier prices on the pricing page. Routed to sales, with a starting figure appearing only in the page metadata.
A stated accuracy percentage. It cites a third-party study rather than publishing its own accuracy metric, and it explicitly frames the goal as trend alignment rather than precision.
The size of the contributors network. Described as millions of devices, without a figure.
Which partners contribute data. Named by category, including ISPs and measurement companies, without naming the organisations.
How the estimate changes when a site connects its own analytics. The recommendation exists; the effect on the public estimate is not described.
FAQ
How accurate is Similarweb?
Similarweb states that it is an estimations tool and does not expect its figures to align exactly with your direct measurement data, aiming instead for trend alignment. It also states that estimates are less accurate for sites under 100,000 monthly visits, and that data will not display for sites whose last snapshot showed fewer than 5,000 monthly visits. It cites a third-party SparkToro study rather than publishing an accuracy percentage of its own.
Why does Similarweb not match Google Analytics?
Because they measure differently and one of them is estimating. Similarweb names four reasons: different methodologies for calculating sessions and other metrics, inconsistent tracking implementation across a company's properties, sampling limits at low volumes, and mismatched comparison parameters such as timeframe or device. It also notes that variance between two direct measurement tools on the same site can reach 30%.
Is Similarweb good for B2B?
For market and competitor questions at category level, yes. For account research on individual mid-market prospects, usually not, because a large share of those sites fall below the 100,000 monthly visit accuracy threshold and many fall below the 5,000 visit display floor. Check a handful of your real target accounts in the free web interface before buying.
How much does Similarweb cost?
Not published in a usable form. The pricing page routes to sales, and while its meta description states pricing begins at $125 a month, the pricing table did not render for us, so we publish no tier figures. Expect to need a sales conversation to get a number, and go into it knowing whether your target accounts clear the display threshold.
What data sources does Similarweb use?
Four, by its own account: first-party analytics data from website and app owners, an anonymous contributors network from Similarweb products installed on millions of devices, publicly available data captured and indexed algorithmically, and partnerships with providers including ISPs, measurement companies and corporate intelligence firms. Everything published is modelled from those inputs.
Should you use Similarweb or your own analytics?
Both, for different questions. Your own analytics is the only measurement of your own site. Similarweb is for questions about sites you do not own, and Similarweb itself recommends connecting Google Analytics to reconcile discrepancies. Treat its numbers as directional and its trends as the useful output.
Bottom line
Judge this one on two published thresholds rather than on the feature list. Nothing displays below roughly 5,000 monthly visits and accuracy degrades below 100,000, which together decide whether the tool can see the companies you actually care about. If your questions are about markets, categories and large properties, it is a strong product and the estimation method is the right one for the job. If your questions are about whether a specific mid-market prospect is growing, the tool will either show you nothing or show you a number Similarweb's own documentation tells you not to treat as precise. Check five real target accounts in the free interface before you book the sales call, because that test costs nothing and answers the only question that matters.
Want the pipeline built rather than the competitor dashboard read? Book a call with GROU. We run lead generation and outbound inside B2B revenue engines across verticals. If you are shopping rather than buying, our Similarweb alternatives piece covers the options and our Semrush alternatives piece covers the SEO toolkits.
We are GROU, a B2B pipeline agency that runs lead generation, outbound, and LinkedIn content for clients across manufacturing, fintech, iGaming, software, and professional services. Some links in this article are affiliate links, including Similarweb. Every claim about the methodology and its thresholds comes from Similarweb's own published documentation, and the review tells a large share of B2B readers to test before buying.

Pipeline OS Newsletter
Build qualified pipeline
Get weekly tactics to generate demand, improve lead quality, and book more meetings.





Trusted by industry leaders
Trusted by industry leaders
Trusted by industry leaders
Ready to build qualified pipeline?
Ready to build qualified pipeline?
Ready to build qualified pipeline?
Book a call to see if we're the right fit, or take the 2-minute quiz to get a clear starting point.
Book a call to see if we're the right fit, or take the 2-minute quiz to get a clear starting point.
Book a call to see if we're the right fit, or take the 2-minute quiz to get a clear starting point.
" height="30.21639343089746px" id="hfGbXmQR2" width="30.216393430897455px"/></svg>)
Copyright © 2026 – All Right Reserved
Copyright © 2026 – All Right Reserved
Copyright © 2026 – All Right Reserved