%22%3E%3C/path%3E%3Cpath d=%22M 63.072 7.554 C 62.258 8.022 61.577 8.689 61.092 9.493 L 61.092 7.076 L 57.158 7.076 L 57.158 22.64 L 61.089 22.64 L 61.089 14.888 C 61.089 13.446 61.403 12.434 62.03 11.853 C 62.818 11.218 63.818 10.907 64.826 10.982 L 65.868 10.982 L 65.868 6.851 C 64.891 6.834 63.926 7.076 63.073 7.554 Z%22 fill=%22rgb(17,17,17)%22%3E%3C/path%3E%3Cpath d=%22M 78.916 7.82 C 76.363 6.49 73.321 6.49 70.768 7.82 C 69.562 8.473 68.564 9.451 67.888 10.644 C 67.167 11.931 66.803 13.387 66.834 14.862 C 66.804 16.332 67.157 17.785 67.86 19.077 C 68.515 20.267 69.494 21.246 70.684 21.901 C 71.924 22.576 73.318 22.92 74.73 22.898 C 76.164 22.918 77.58 22.575 78.846 21.901 C 80.062 21.247 81.073 20.27 81.768 19.077 C 82.506 17.797 82.88 16.339 82.85 14.862 C 82.88 13.389 82.517 11.934 81.797 10.647 C 81.12 9.455 80.122 8.477 78.917 7.824 M 78.803 14.862 C 78.829 15.739 78.636 16.608 78.241 17.391 C 77.903 18.046 77.38 18.588 76.738 18.95 C 76.124 19.293 75.432 19.472 74.729 19.47 C 73.668 19.497 72.648 19.061 71.934 18.276 C 71.139 17.323 70.741 16.1 70.823 14.862 C 70.741 13.62 71.149 12.395 71.959 11.45 C 72.687 10.667 73.715 10.233 74.783 10.256 C 75.859 10.236 76.894 10.67 77.635 11.45 C 78.464 12.387 78.884 13.616 78.801 14.864%22 fill=%22rgb(17,17,17)%22%3E%3C/path%3E%3Cpath d=%22M 95.906 7.076 L 95.906 15.646 C 95.975 16.68 95.643 17.701 94.979 18.498 C 94.311 19.184 93.379 19.547 92.422 19.495 C 91.475 19.544 90.553 19.18 89.894 18.498 C 89.23 17.701 88.898 16.68 88.967 15.646 L 88.967 7.076 L 85.033 7.076 L 85.033 16.207 C 85 17.449 85.275 18.68 85.834 19.79 C 86.327 20.75 87.095 21.542 88.039 22.065 C 89.033 22.594 90.145 22.861 91.271 22.838 C 92.188 22.847 93.095 22.65 93.926 22.263 C 94.708 21.905 95.388 21.36 95.906 20.675 L 95.906 22.645 L 99.865 22.645 L 99.865 7.076 Z%22 fill=%22rgb(17,17,17)%22%3E%3C/path%3E%3Cpath d=%22M 4.513 15.626 C 4.511 10.815 7.606 6.549 12.181 5.059 C 16.756 3.57 21.77 5.195 24.601 9.086 L 27.816 5.87 C 24.074 1.186 17.981 -0.943 12.137 0.393 C 6.292 1.728 1.728 6.292 0.393 12.137 C -0.943 17.981 1.186 24.074 5.87 27.816 L 9.085 24.601 C 6.214 22.512 4.515 19.177 4.513 15.626%22 fill=%22rgb(32,62,235)%22%3E%3C/path%3E%3Cpath d=%22M 17.114 14.343 L 13.354 18.01 L 13.354 18.026 L 21.071 18.026 L 11.412 27.609 L 17.389 27.609 L 23.999 21.081 L 23.999 28.316 L 24.005 28.316 L 27.967 24.393 L 27.967 14.343 Z%22 fill=%22rgb(32,62,235)%22%3E%3C/path%3E%3C/g%3E%3C/svg%3E) ×
× ××
××›
›
›
›
Account based marketing for manufacturers: the 2026 playbook
Account based marketing for manufacturers: the 2026 playbook
Account based marketing for manufacturers: the 2026 playbook
Account based marketing for manufacturers: the 2026 playbook
Account based marketing for manufacturers: the 2026 playbook
Account based marketing for manufacturers: the 2026 playbook

Author
Aljaz Peklaj

Most manufacturing ABM programs don't fail because the team lacks another data platform. They fail because a broad firmographic list gets treated as a buying window. That approach produces activity, not pipeline.
Build the target list backwards from closed-won revenue.
Admit accounts only when operational signals and account fit align.
Reach the full buying committee, not one enthusiastic contact.
Measure account progression and revenue timing, not lead volume.
ABM has already moved beyond a niche B2B tactic. A 2025 industry analysis cited by Lead Forensics' manufacturing marketing statistics says 76% of B2B companies have adopted some form of ABM, while 81% of B2B marketers in a manufacturing-focused analysis believe ABM delivers stronger ROI than other marketing initiatives. The opportunity is real, but structure determines whether attention becomes pipeline.
Table of Contents
Why most manufacturing ABM programs fail before they start
The popular advice is to identify companies by revenue, headcount, geography, and industry code, then place them into an always-on sequence. That's ordinary outbound with an ABM label.
Manufacturing buyers don't operate like SaaS prospects. A capital equipment purchase can involve operations, procurement, finance, engineering, and executive sponsors. Gartner research summarized in B2B buying committee reporting puts the typical B2B committee at roughly 6 to 10 stakeholders across about five business functions, with more complex purchases reaching a dozen or more people.
A static account list also decays quickly. Plants change capacity, leaders move, projects pause, and budgets shift. A company that fit your ICP last quarter may have no active reason to speak with you now.
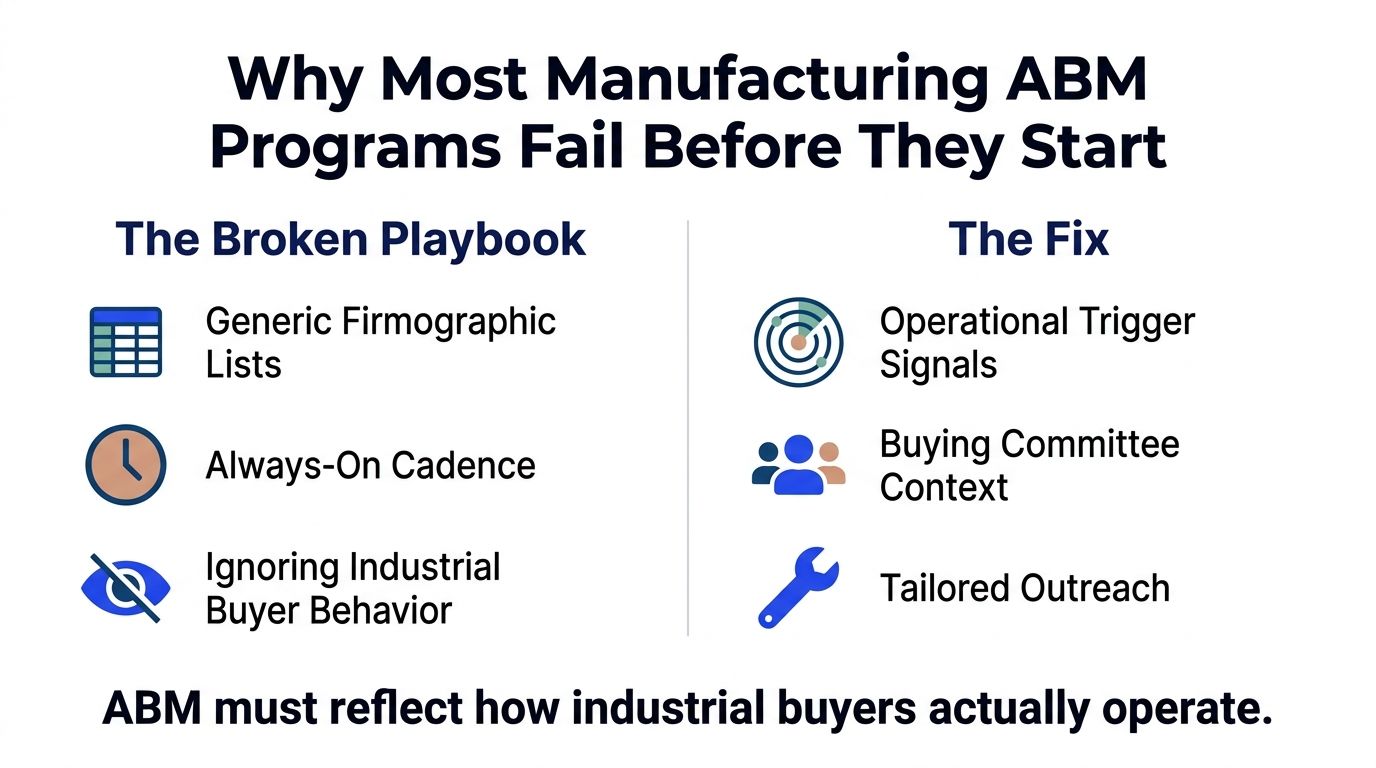
The three structural failures
Static lists: Firmographics identify possible fit, but they rarely reveal whether a plant has an active project.
Untimed outreach: A sequence that starts on day one of your campaign says nothing about the account's capital cycle.
Weak handoffs: Marketing passes engagement to sales as an endpoint, rather than giving sales the account context, trigger, stakeholders, and next action.
That last failure creates a familiar dashboard. Marketing reports account engagement. Sales sees one contact who downloaded a document. Nobody can explain why the account should move now.
For teams reviewing manufacturing lead generation, the practical fix is signal-triggered intake. An account stays in monitoring until a defined operational event appears, then enrichment, messaging, and sales coverage begin.
Practical rule: An account shouldn't enter an active sequence merely because it matches your ICP. It should enter when fit and timing create a credible buying window.
Targeted manufacturer outbound campaigns can be useful, provided the campaign begins with account evidence rather than a spreadsheet export. The system should answer three questions before the first touch: what changed, who cares, and why now?
Building target account lists from closed-won deals
The first step isn't building a list. It's reverse-engineering the accounts that already bought.
Pull the last 20 to 30 closed-won accounts, then inspect what was true before the first meeting. Review CRM notes, call recordings, proposals, plant locations, leadership changes, project announcements, and lost-deal context. Firmographics are the floor. Your useful criteria usually sit in the operational details salespeople remember but databases don't capture.
Start with compound evidence
One industrial equipment client initially described its market as industrial manufacturers with 200 to 1,000 employees across DACH and CEE. That produced roughly 2,400 accounts, but the list had little relationship to active buying intent.
Reverse-engineering closed-won deals revealed a tighter pattern. Buyers had announced a capacity expansion, such as a new line, plant, or shift, within the prior 9 months, and a plant or operations executive had been in post for less than 18 months.
The two signals mattered together. Expansion indicated a live project. A recently appointed executive indicated someone had a mandate to change performance and a reason to prove progress. Applying both criteria reduced the list to 187 accounts, discarding 92% of the original qualified list. Those accounts produced 78 qualified opportunities and 16 closes, with an average deal size of €148k, according to the client program data supplied for this analysis.
That's the standard to aim for. Your target list should resemble the accounts you've won, not the entire market that could theoretically buy.
Tier accounts by evidence, not enthusiasm
Use four signal dimensions, then assign an account tier based on the evidence available:
Signal dimension | Tier 1, 3+ signals | Tier 2, 2 signals | Tier 3, monitor |
|---|---|---|---|
Operational change | Expansion plus a facility, equipment, or production event | One verified operational event | No current project evidence |
Leadership | New operations, engineering, or procurement leader | Relevant leadership movement | Stable leadership |
Financial context | Contract win, funding, or visible investment pressure | One financial indicator | No confirmed financial change |
Technology gap | Legacy system or equipment approaching end of life | Suspected replacement need | No validated gap |
Tier 1 accounts earn active research and personalized outreach. Tier 2 accounts receive lighter account development while the team looks for a confirming event. Tier 3 accounts remain in monitoring, because spending sales capacity on an untriggered account is usually premature.
Document the logic in your target account list, including the source, date, confidence, and owner for every signal. If a salesperson can't see why an account entered the list, the criteria are too vague.
Detecting operational trigger signals with waterfall enrichment
Manufacturing signals rarely live in one clean database. Expansion plans may appear in municipal permits, regional business journals, trade publications, job postings, earnings commentary, or company announcements. Each source has gaps, so a single-source workflow creates false confidence.
A waterfall enrichment stack solves a data coverage problem by checking several sources in sequence. Start with your base account list, then scan for relevant signals across four to six data providers each week. The exact providers depend on region and industry, but the logic stays consistent.
Intent data: Look for account-level research activity and topic interest. Treat it as an early clue, not proof, because offline manufacturing research often won't appear there.
Facility and capex sources: Check permits, expansion announcements, plant investments, and local filings.
Leadership monitoring: Track LinkedIn changes, executive hiring activity, and relevant search announcements.
Financial sources: Review earnings calls, public filings, contract wins, and trade credit information.
Validation: Require confirmation from at least two independent sources before active outreach.
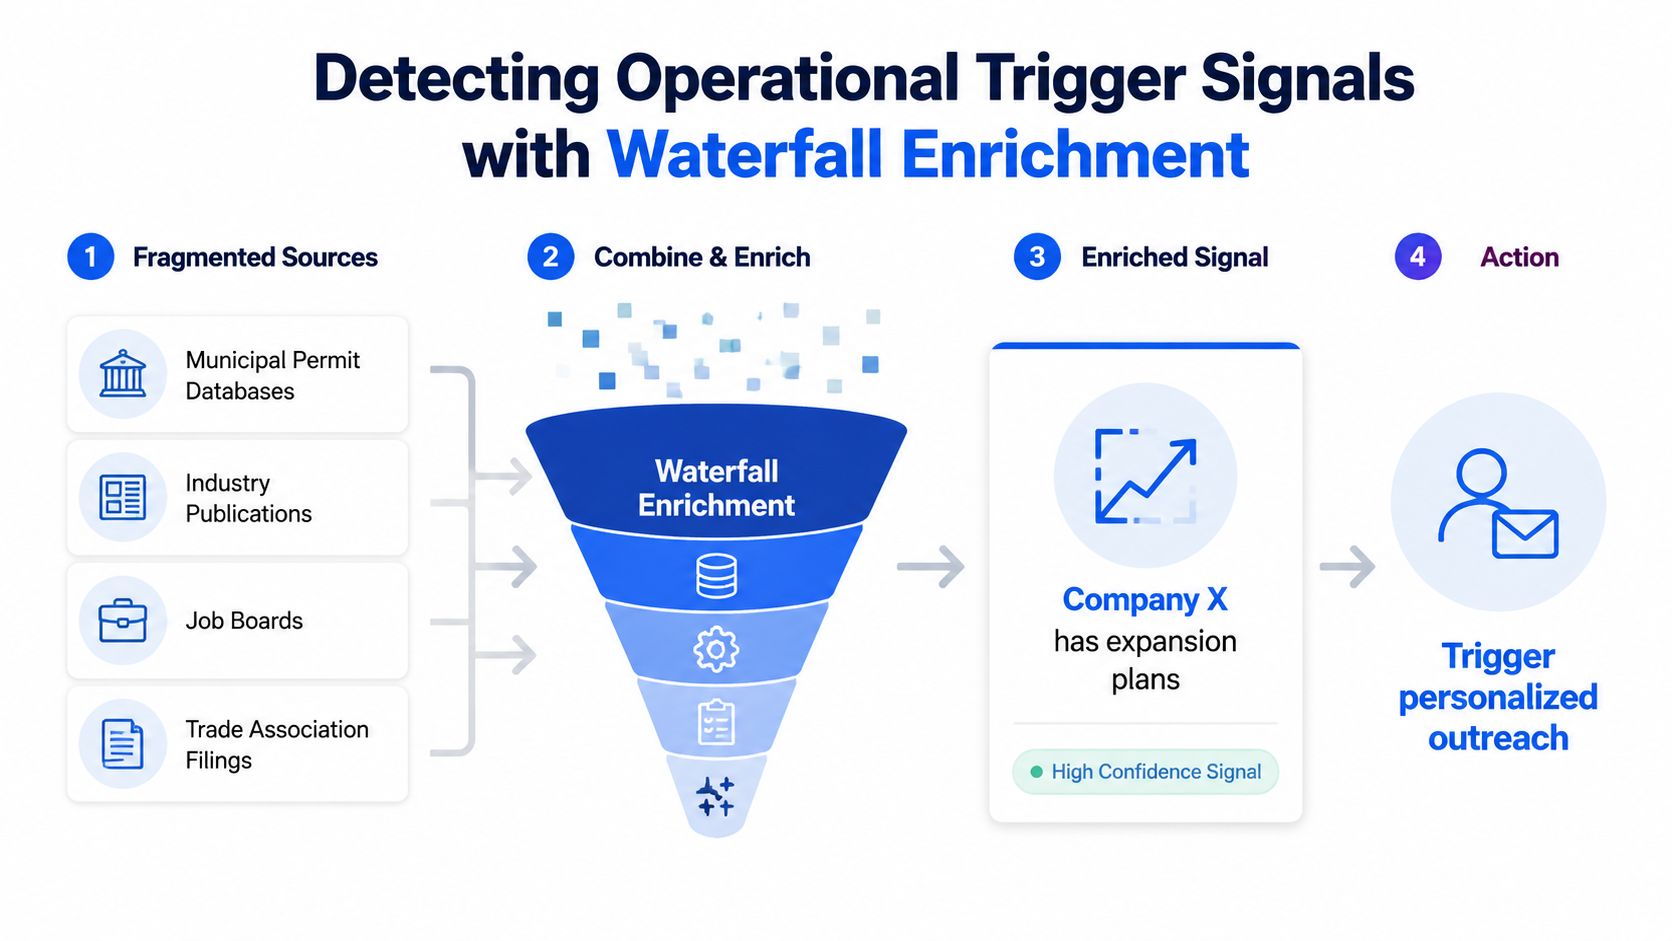
Score recency and relevance separately
A recent plant expansion deserves more attention than an old hiring announcement. A signal tied to the facility where your solution applies also deserves more weight than a corporate-level event with no operational detail.
Store each signal with its date, source, plant or business unit, affected function, and confidence level. Clay can run waterfall enrichment across multiple providers, then write the result into HubSpot or another CRM. Apollo, Sales Navigator, and specialist monitoring sources can support contact discovery, while the CRM remains the system of record.
The point isn't to collect more fields. It's to create a reliable intake decision.
A signal becomes actionable when a human can verify it, explain its relevance, and connect it to a specific stakeholder.
Accounts with one weak signal should wait. Accounts with two corroborated signals can enter research. Accounts with a compound event, clear fit, and identifiable committee deserve active sequencing. Teams building this flow can reference a waterfall enrichment workflow to formalize the handoff between data collection and outreach.
Mapping the manufacturing buying committee across functions
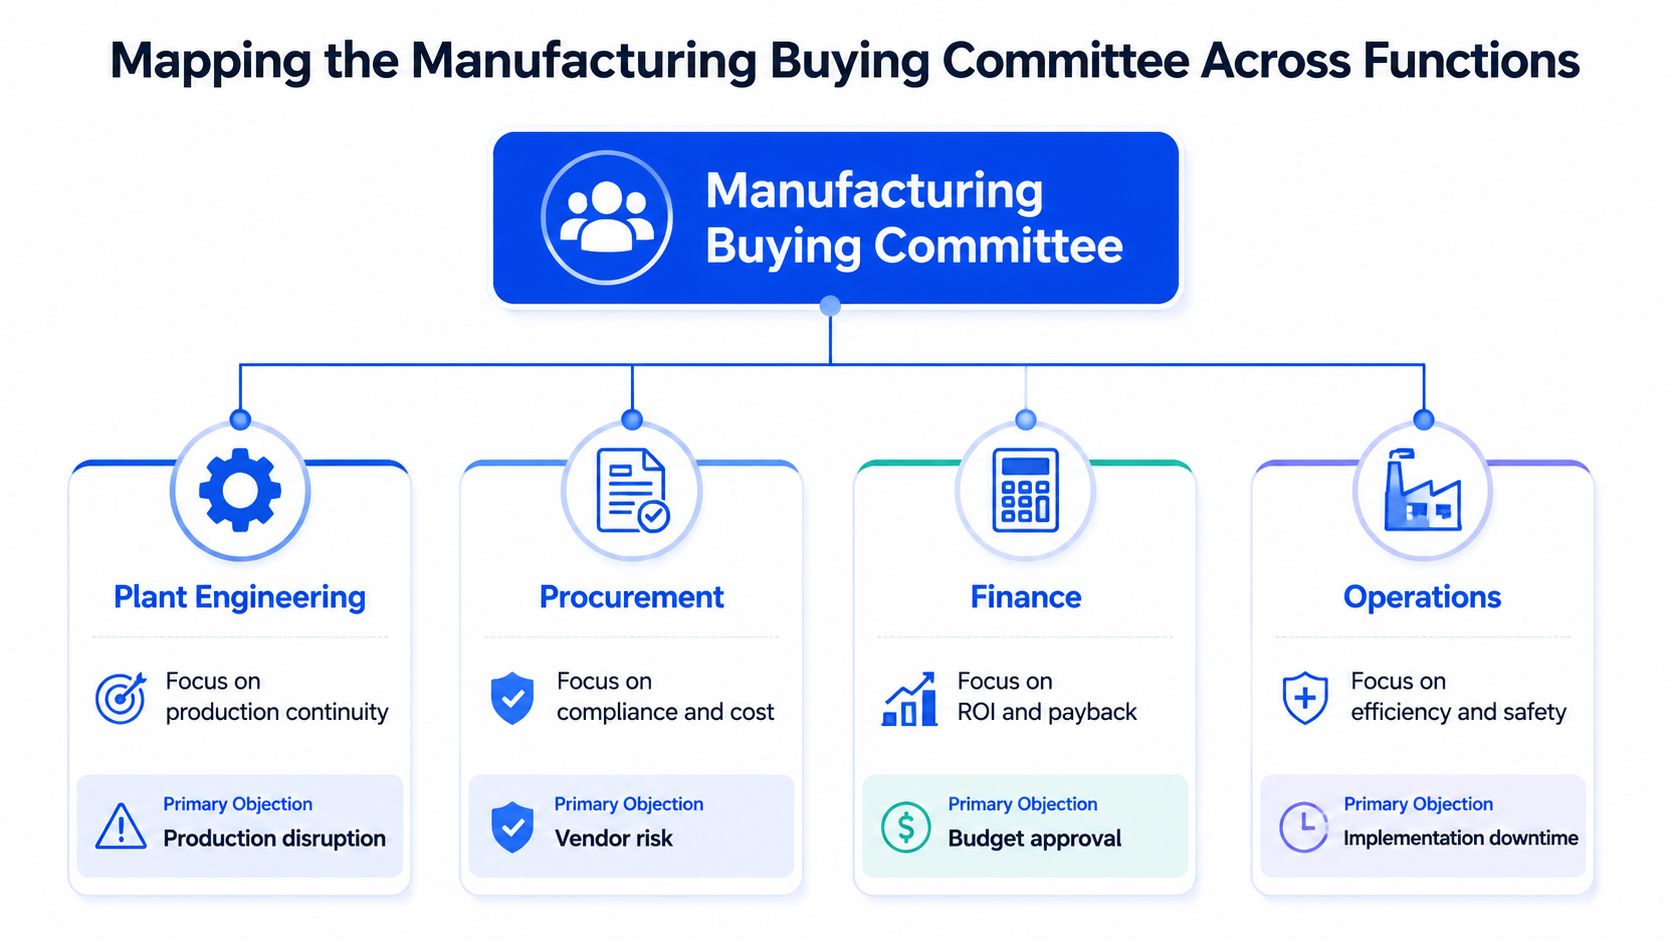
Manufacturing deals usually stall after the champion has agreed there is a problem. The hold-up comes from another function raising an unanswered concern about installation, compliance, integration, budget, or operational risk.
A current benchmark places enterprise buying committees in the 6 to 10 stakeholder range, according to enterprise buying committee benchmarks. For larger manufacturing contracts, broader stakeholder coverage matters more than sending additional messages to the first contact.
Build the matrix around objections
Function | What they protect | Likely objection | Useful proof |
|---|---|---|---|
Plant engineering | Production continuity | “Will installation disrupt output?” | Integration plan, technical validation, site requirements |
Operations | Efficiency and safety | “Can the plant adopt this without downtime?” | Operating workflow, implementation sequence, safety impact |
Procurement | Compliance and cost | “How do we control vendor and commercial risk?” | Commercial terms, supplier documentation, service coverage |
Finance | Payback and budget control | “Does this investment meet our hurdle?” | Facility-level ROI model, cost assumptions, payback logic |
IT or systems | Data and integration | “How will this connect to existing systems?” | Architecture, security documentation, ownership model |
Executive sponsor | Strategic delivery | “Will this help deliver the mandate?” | Business case tied to the announced operational change |
A plant manager and a CFO should not receive the same compliance deck. The plant manager needs evidence about downtime and adoption. Procurement needs supplier documentation and service coverage. Finance needs a model with visible assumptions, while engineering needs proof that the equipment or system fits the existing environment.
Build one account-plan row for each stakeholder. Include role, influence, current position, objection, trigger relevance, message angle, channel, and next action. Mark the relationship as unknown, contacted, engaged, validated, or championed. CRM visibility exposes missing coverage instead of leaving the committee inside an account executive's notes.
Use how to map your buying committee to structure the people and motivations involved. Keep account records aligned with the team's buying committee process, so marketing and sales apply the same definitions.
Trigger relevance should shape the map. If a plant expansion created the opportunity, start with the functions that will carry the implementation burden, then identify the people who control commercial approval. This keeps outreach connected to the operational event rather than a generic firmographic list or an always-on cadence.
Start with technical credibility before applying commercial pressure. Early engineering validation gives procurement fewer unresolved questions later. It will not remove every negotiation step, but it reduces avoidable rework and shows where the deal still lacks coverage.
The following video provides a visual reference for thinking about buying roles and internal decision paths.
Running signal-triggered outbound sequences that convert
A generic cadence starts with your calendar. A signal-triggered sequence starts with the account's event.
For the industrial equipment client described earlier, the sequence began when the expansion signal and leadership change were both confirmed. Within 48 hours, the prospect received a short Loom video naming the plant, the expansion, and the operational issue the change could create. The video was not polished. It was specific.
Manufacturing executives tend to respond to evidence that the sender understands the operation. A produced brand video asks the buyer to watch marketing. A rough, 60 to 90-second Loom shows that someone researched the account.
The proposal-stage version of this asset drove a 40% to 60% lift in proposal-to-close conversion and a 9-day median cycle compression, based on the client program data supplied for this article. The same campaign's blended reply rate sat in an 11% to 14% band, with the top triggered segment reaching 14.7%, while the video touch was the highest-replying single step.
Use branches instead of forced persistence
Day | Channel | Format | Trigger dependency | Objective |
|---|---|---|---|---|
0 | Signal-led opener | Confirmed operational event | Establish relevance | |
1-2 | Loom | Personalized video | Plant or leadership context available | Prove account research |
4 | Comment and connect | Relevant public post or profile | Add a familiar channel | |
7 | Value hypothesis | Facility problem can be stated | Test business relevance | |
10 | Call | Sales conversation | Contact or committee role identified | Validate urgency |
14 | One-page ROI model | Facility assumptions available | Give finance a reason to engage | |
21 | Email or LinkedIn | Close or monitor branch | Signal remains active or goes dark | Set the next review point |
The ROI model should stay narrow. Scope it to the facility type, production context, and measurable cost assumption you can defend. Don't send a generic white paper at this stage. White papers work better during technical validation, when engineering or procurement needs documentation.
If the signal disappears, stop the active sequence. Mark the account for monitoring and define the next trigger, such as another capacity announcement, a leadership move, or a quarterly update. Lemlist, Instantly, Smartlead, and HeyReach can handle channel execution, but none of them can compensate for weak intake logic.
Keep the CRM state explicit: signal detected, enriched, committee mapped, sequence active, meeting held, opportunity created, or monitor. A cold email should be one action inside that system, not the system itself.
Measuring ABM impact across long manufacturing sales cycles
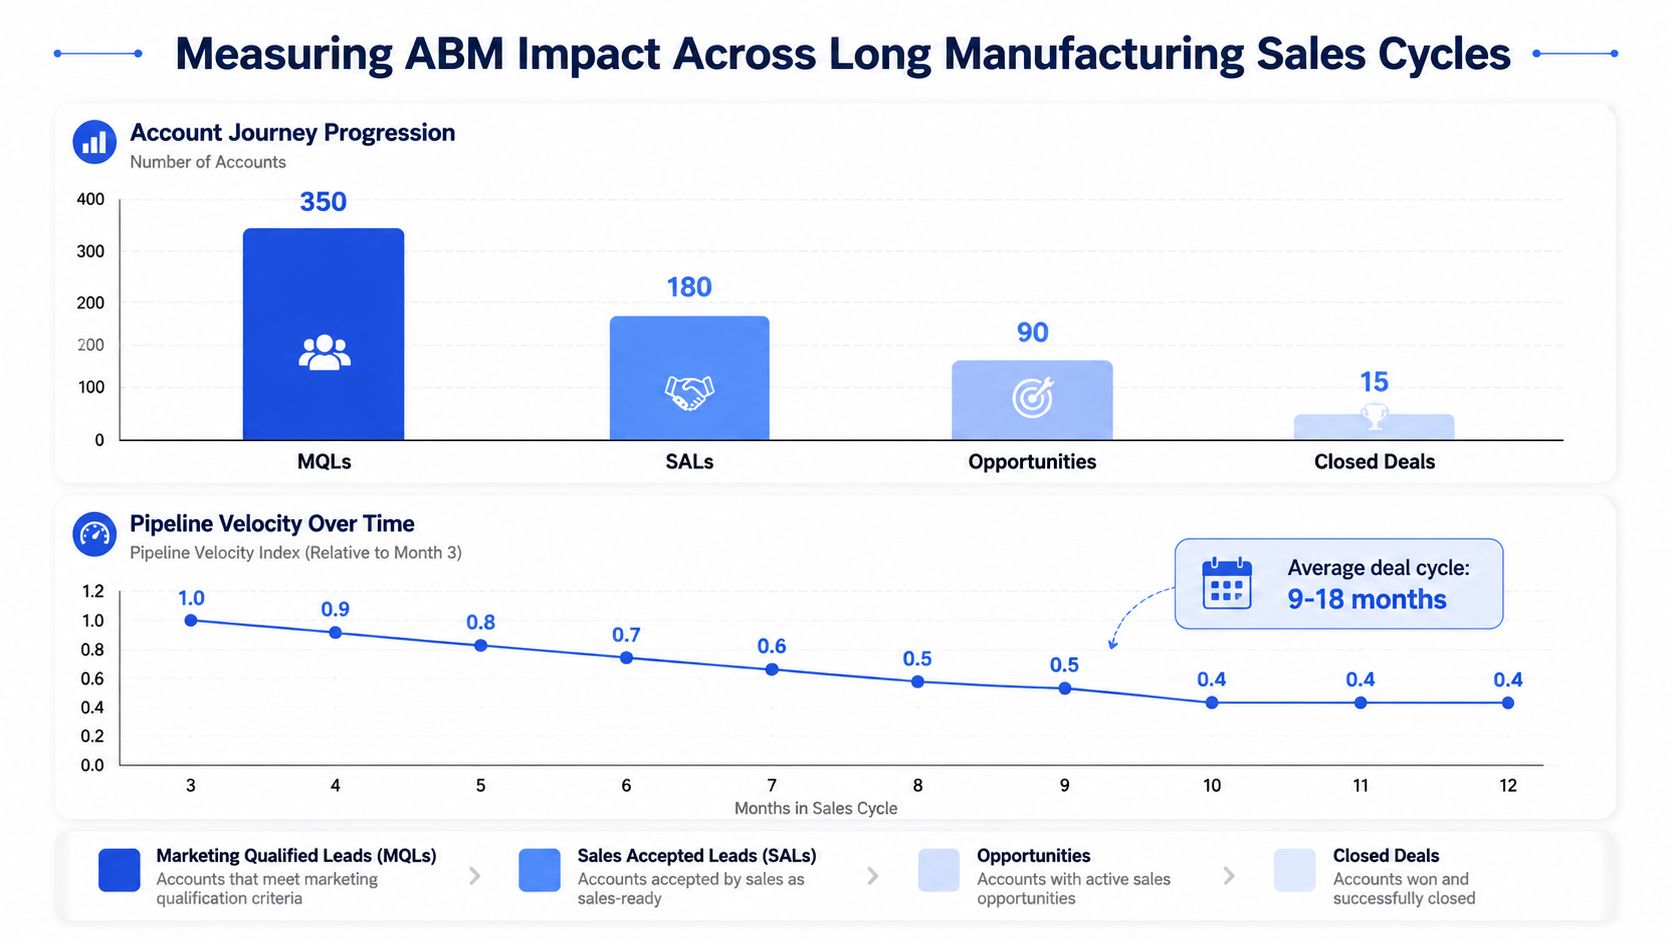
Manufacturing ABM should measure account progression, not activity volume. Clicks and form fills can rise while the account remains single-threaded, commercially unqualified, and far from a buying decision.
A benchmark for manufacturing ABM reports that stronger programs reach 85% of buying-committee members, compared with 61% for less mature programs, according to account based marketing benchmarks. The same source reports stronger programs achieving roughly 8% to 12% from account to opportunity, 20% to 33% ACV lift, and 100% to 234% pipeline-velocity lift.
Treat those figures as reference points, not targets to copy blindly. Build the operating dashboard around three layers:
Coverage: Percentage of known committee roles reached, signal-to-first-meeting latency, and stakeholder expansion within the account.
Progression: Movement from engaged account to meeting, opportunity, technical validation, proposal, and commercial approval.
Economics: Sourced and influenced pipeline, CAC, win rate by trigger type, average contract value, and revenue timing.
Attribute the work without rewarding noise
Multi-touch attribution often gives too much credit to the final meeting, proposal, or email reply. That obscures the verified trigger and committee-building work that created the later opportunity.
Use a weighted account model. Give meaningful credit to the verified trigger, first accepted meeting, committee expansion, technical validation, proposal, and closed revenue. Keep sourced and influenced pipeline separate, then review the rules with sales and finance before applying them to budget decisions.
According to the client program data supplied for this analysis, the program produced €2.36M attributed revenue on €192k invested, a 12.3x return, with an average deal value of €148k. The same data records a cycle change from roughly 240 days to 187 days, a 22% compression, as outreach entered during the active project window and proposal-stage communication reduced avoidable delay. Treat this as program-specific evidence, not a benchmark for every manufacturer.
A practical guide to ABM for revenue ops can help connect account stages, CRM ownership, and reporting rules. The CFO needs a clear view of whether signal-based intake finds better-timed accounts, reaches the committee, creates qualified opportunities, and brings revenue forward.
GROU helps B2B teams connect target-account research, LinkedIn content, lead generation, and outbound in one pipeline system, including signal-triggered intake for manufacturing accounts. Visit Grou to review account criteria, enrichment flow, and reporting before adding volume.
This Friday, pull your last 20 to 30 closed-won manufacturing accounts into a sheet. Add the operational events that preceded each deal, then identify the first compound criterion appearing across multiple wins. Do not launch another sequence until that criterion is visible in your CRM.
Most manufacturing ABM programs don't fail because the team lacks another data platform. They fail because a broad firmographic list gets treated as a buying window. That approach produces activity, not pipeline.
Build the target list backwards from closed-won revenue.
Admit accounts only when operational signals and account fit align.
Reach the full buying committee, not one enthusiastic contact.
Measure account progression and revenue timing, not lead volume.
ABM has already moved beyond a niche B2B tactic. A 2025 industry analysis cited by Lead Forensics' manufacturing marketing statistics says 76% of B2B companies have adopted some form of ABM, while 81% of B2B marketers in a manufacturing-focused analysis believe ABM delivers stronger ROI than other marketing initiatives. The opportunity is real, but structure determines whether attention becomes pipeline.
Table of Contents
Why most manufacturing ABM programs fail before they start
The popular advice is to identify companies by revenue, headcount, geography, and industry code, then place them into an always-on sequence. That's ordinary outbound with an ABM label.
Manufacturing buyers don't operate like SaaS prospects. A capital equipment purchase can involve operations, procurement, finance, engineering, and executive sponsors. Gartner research summarized in B2B buying committee reporting puts the typical B2B committee at roughly 6 to 10 stakeholders across about five business functions, with more complex purchases reaching a dozen or more people.
A static account list also decays quickly. Plants change capacity, leaders move, projects pause, and budgets shift. A company that fit your ICP last quarter may have no active reason to speak with you now.
The three structural failures
Static lists: Firmographics identify possible fit, but they rarely reveal whether a plant has an active project.
Untimed outreach: A sequence that starts on day one of your campaign says nothing about the account's capital cycle.
Weak handoffs: Marketing passes engagement to sales as an endpoint, rather than giving sales the account context, trigger, stakeholders, and next action.
That last failure creates a familiar dashboard. Marketing reports account engagement. Sales sees one contact who downloaded a document. Nobody can explain why the account should move now.
For teams reviewing manufacturing lead generation, the practical fix is signal-triggered intake. An account stays in monitoring until a defined operational event appears, then enrichment, messaging, and sales coverage begin.
Practical rule: An account shouldn't enter an active sequence merely because it matches your ICP. It should enter when fit and timing create a credible buying window.
Targeted manufacturer outbound campaigns can be useful, provided the campaign begins with account evidence rather than a spreadsheet export. The system should answer three questions before the first touch: what changed, who cares, and why now?
Building target account lists from closed-won deals
The first step isn't building a list. It's reverse-engineering the accounts that already bought.
Pull the last 20 to 30 closed-won accounts, then inspect what was true before the first meeting. Review CRM notes, call recordings, proposals, plant locations, leadership changes, project announcements, and lost-deal context. Firmographics are the floor. Your useful criteria usually sit in the operational details salespeople remember but databases don't capture.
Start with compound evidence
One industrial equipment client initially described its market as industrial manufacturers with 200 to 1,000 employees across DACH and CEE. That produced roughly 2,400 accounts, but the list had little relationship to active buying intent.
Reverse-engineering closed-won deals revealed a tighter pattern. Buyers had announced a capacity expansion, such as a new line, plant, or shift, within the prior 9 months, and a plant or operations executive had been in post for less than 18 months.
The two signals mattered together. Expansion indicated a live project. A recently appointed executive indicated someone had a mandate to change performance and a reason to prove progress. Applying both criteria reduced the list to 187 accounts, discarding 92% of the original qualified list. Those accounts produced 78 qualified opportunities and 16 closes, with an average deal size of €148k, according to the client program data supplied for this analysis.
That's the standard to aim for. Your target list should resemble the accounts you've won, not the entire market that could theoretically buy.
Tier accounts by evidence, not enthusiasm
Use four signal dimensions, then assign an account tier based on the evidence available:
Signal dimension | Tier 1, 3+ signals | Tier 2, 2 signals | Tier 3, monitor |
|---|---|---|---|
Operational change | Expansion plus a facility, equipment, or production event | One verified operational event | No current project evidence |
Leadership | New operations, engineering, or procurement leader | Relevant leadership movement | Stable leadership |
Financial context | Contract win, funding, or visible investment pressure | One financial indicator | No confirmed financial change |
Technology gap | Legacy system or equipment approaching end of life | Suspected replacement need | No validated gap |
Tier 1 accounts earn active research and personalized outreach. Tier 2 accounts receive lighter account development while the team looks for a confirming event. Tier 3 accounts remain in monitoring, because spending sales capacity on an untriggered account is usually premature.
Document the logic in your target account list, including the source, date, confidence, and owner for every signal. If a salesperson can't see why an account entered the list, the criteria are too vague.
Detecting operational trigger signals with waterfall enrichment
Manufacturing signals rarely live in one clean database. Expansion plans may appear in municipal permits, regional business journals, trade publications, job postings, earnings commentary, or company announcements. Each source has gaps, so a single-source workflow creates false confidence.
A waterfall enrichment stack solves a data coverage problem by checking several sources in sequence. Start with your base account list, then scan for relevant signals across four to six data providers each week. The exact providers depend on region and industry, but the logic stays consistent.
Intent data: Look for account-level research activity and topic interest. Treat it as an early clue, not proof, because offline manufacturing research often won't appear there.
Facility and capex sources: Check permits, expansion announcements, plant investments, and local filings.
Leadership monitoring: Track LinkedIn changes, executive hiring activity, and relevant search announcements.
Financial sources: Review earnings calls, public filings, contract wins, and trade credit information.
Validation: Require confirmation from at least two independent sources before active outreach.
Score recency and relevance separately
A recent plant expansion deserves more attention than an old hiring announcement. A signal tied to the facility where your solution applies also deserves more weight than a corporate-level event with no operational detail.
Store each signal with its date, source, plant or business unit, affected function, and confidence level. Clay can run waterfall enrichment across multiple providers, then write the result into HubSpot or another CRM. Apollo, Sales Navigator, and specialist monitoring sources can support contact discovery, while the CRM remains the system of record.
The point isn't to collect more fields. It's to create a reliable intake decision.
A signal becomes actionable when a human can verify it, explain its relevance, and connect it to a specific stakeholder.
Accounts with one weak signal should wait. Accounts with two corroborated signals can enter research. Accounts with a compound event, clear fit, and identifiable committee deserve active sequencing. Teams building this flow can reference a waterfall enrichment workflow to formalize the handoff between data collection and outreach.
Mapping the manufacturing buying committee across functions
Manufacturing deals usually stall after the champion has agreed there is a problem. The hold-up comes from another function raising an unanswered concern about installation, compliance, integration, budget, or operational risk.
A current benchmark places enterprise buying committees in the 6 to 10 stakeholder range, according to enterprise buying committee benchmarks. For larger manufacturing contracts, broader stakeholder coverage matters more than sending additional messages to the first contact.
Build the matrix around objections
Function | What they protect | Likely objection | Useful proof |
|---|---|---|---|
Plant engineering | Production continuity | “Will installation disrupt output?” | Integration plan, technical validation, site requirements |
Operations | Efficiency and safety | “Can the plant adopt this without downtime?” | Operating workflow, implementation sequence, safety impact |
Procurement | Compliance and cost | “How do we control vendor and commercial risk?” | Commercial terms, supplier documentation, service coverage |
Finance | Payback and budget control | “Does this investment meet our hurdle?” | Facility-level ROI model, cost assumptions, payback logic |
IT or systems | Data and integration | “How will this connect to existing systems?” | Architecture, security documentation, ownership model |
Executive sponsor | Strategic delivery | “Will this help deliver the mandate?” | Business case tied to the announced operational change |
A plant manager and a CFO should not receive the same compliance deck. The plant manager needs evidence about downtime and adoption. Procurement needs supplier documentation and service coverage. Finance needs a model with visible assumptions, while engineering needs proof that the equipment or system fits the existing environment.
Build one account-plan row for each stakeholder. Include role, influence, current position, objection, trigger relevance, message angle, channel, and next action. Mark the relationship as unknown, contacted, engaged, validated, or championed. CRM visibility exposes missing coverage instead of leaving the committee inside an account executive's notes.
Use how to map your buying committee to structure the people and motivations involved. Keep account records aligned with the team's buying committee process, so marketing and sales apply the same definitions.
Trigger relevance should shape the map. If a plant expansion created the opportunity, start with the functions that will carry the implementation burden, then identify the people who control commercial approval. This keeps outreach connected to the operational event rather than a generic firmographic list or an always-on cadence.
Start with technical credibility before applying commercial pressure. Early engineering validation gives procurement fewer unresolved questions later. It will not remove every negotiation step, but it reduces avoidable rework and shows where the deal still lacks coverage.
The following video provides a visual reference for thinking about buying roles and internal decision paths.
Running signal-triggered outbound sequences that convert
A generic cadence starts with your calendar. A signal-triggered sequence starts with the account's event.
For the industrial equipment client described earlier, the sequence began when the expansion signal and leadership change were both confirmed. Within 48 hours, the prospect received a short Loom video naming the plant, the expansion, and the operational issue the change could create. The video was not polished. It was specific.
Manufacturing executives tend to respond to evidence that the sender understands the operation. A produced brand video asks the buyer to watch marketing. A rough, 60 to 90-second Loom shows that someone researched the account.
The proposal-stage version of this asset drove a 40% to 60% lift in proposal-to-close conversion and a 9-day median cycle compression, based on the client program data supplied for this article. The same campaign's blended reply rate sat in an 11% to 14% band, with the top triggered segment reaching 14.7%, while the video touch was the highest-replying single step.
Use branches instead of forced persistence
Day | Channel | Format | Trigger dependency | Objective |
|---|---|---|---|---|
0 | Signal-led opener | Confirmed operational event | Establish relevance | |
1-2 | Loom | Personalized video | Plant or leadership context available | Prove account research |
4 | Comment and connect | Relevant public post or profile | Add a familiar channel | |
7 | Value hypothesis | Facility problem can be stated | Test business relevance | |
10 | Call | Sales conversation | Contact or committee role identified | Validate urgency |
14 | One-page ROI model | Facility assumptions available | Give finance a reason to engage | |
21 | Email or LinkedIn | Close or monitor branch | Signal remains active or goes dark | Set the next review point |
The ROI model should stay narrow. Scope it to the facility type, production context, and measurable cost assumption you can defend. Don't send a generic white paper at this stage. White papers work better during technical validation, when engineering or procurement needs documentation.
If the signal disappears, stop the active sequence. Mark the account for monitoring and define the next trigger, such as another capacity announcement, a leadership move, or a quarterly update. Lemlist, Instantly, Smartlead, and HeyReach can handle channel execution, but none of them can compensate for weak intake logic.
Keep the CRM state explicit: signal detected, enriched, committee mapped, sequence active, meeting held, opportunity created, or monitor. A cold email should be one action inside that system, not the system itself.
Measuring ABM impact across long manufacturing sales cycles
Manufacturing ABM should measure account progression, not activity volume. Clicks and form fills can rise while the account remains single-threaded, commercially unqualified, and far from a buying decision.
A benchmark for manufacturing ABM reports that stronger programs reach 85% of buying-committee members, compared with 61% for less mature programs, according to account based marketing benchmarks. The same source reports stronger programs achieving roughly 8% to 12% from account to opportunity, 20% to 33% ACV lift, and 100% to 234% pipeline-velocity lift.
Treat those figures as reference points, not targets to copy blindly. Build the operating dashboard around three layers:
Coverage: Percentage of known committee roles reached, signal-to-first-meeting latency, and stakeholder expansion within the account.
Progression: Movement from engaged account to meeting, opportunity, technical validation, proposal, and commercial approval.
Economics: Sourced and influenced pipeline, CAC, win rate by trigger type, average contract value, and revenue timing.
Attribute the work without rewarding noise
Multi-touch attribution often gives too much credit to the final meeting, proposal, or email reply. That obscures the verified trigger and committee-building work that created the later opportunity.
Use a weighted account model. Give meaningful credit to the verified trigger, first accepted meeting, committee expansion, technical validation, proposal, and closed revenue. Keep sourced and influenced pipeline separate, then review the rules with sales and finance before applying them to budget decisions.
According to the client program data supplied for this analysis, the program produced €2.36M attributed revenue on €192k invested, a 12.3x return, with an average deal value of €148k. The same data records a cycle change from roughly 240 days to 187 days, a 22% compression, as outreach entered during the active project window and proposal-stage communication reduced avoidable delay. Treat this as program-specific evidence, not a benchmark for every manufacturer.
A practical guide to ABM for revenue ops can help connect account stages, CRM ownership, and reporting rules. The CFO needs a clear view of whether signal-based intake finds better-timed accounts, reaches the committee, creates qualified opportunities, and brings revenue forward.
GROU helps B2B teams connect target-account research, LinkedIn content, lead generation, and outbound in one pipeline system, including signal-triggered intake for manufacturing accounts. Visit Grou to review account criteria, enrichment flow, and reporting before adding volume.
This Friday, pull your last 20 to 30 closed-won manufacturing accounts into a sheet. Add the operational events that preceded each deal, then identify the first compound criterion appearing across multiple wins. Do not launch another sequence until that criterion is visible in your CRM.
Most manufacturing ABM programs don't fail because the team lacks another data platform. They fail because a broad firmographic list gets treated as a buying window. That approach produces activity, not pipeline.
Build the target list backwards from closed-won revenue.
Admit accounts only when operational signals and account fit align.
Reach the full buying committee, not one enthusiastic contact.
Measure account progression and revenue timing, not lead volume.
ABM has already moved beyond a niche B2B tactic. A 2025 industry analysis cited by Lead Forensics' manufacturing marketing statistics says 76% of B2B companies have adopted some form of ABM, while 81% of B2B marketers in a manufacturing-focused analysis believe ABM delivers stronger ROI than other marketing initiatives. The opportunity is real, but structure determines whether attention becomes pipeline.
Table of Contents
Why most manufacturing ABM programs fail before they start
The popular advice is to identify companies by revenue, headcount, geography, and industry code, then place them into an always-on sequence. That's ordinary outbound with an ABM label.
Manufacturing buyers don't operate like SaaS prospects. A capital equipment purchase can involve operations, procurement, finance, engineering, and executive sponsors. Gartner research summarized in B2B buying committee reporting puts the typical B2B committee at roughly 6 to 10 stakeholders across about five business functions, with more complex purchases reaching a dozen or more people.
A static account list also decays quickly. Plants change capacity, leaders move, projects pause, and budgets shift. A company that fit your ICP last quarter may have no active reason to speak with you now.
The three structural failures
Static lists: Firmographics identify possible fit, but they rarely reveal whether a plant has an active project.
Untimed outreach: A sequence that starts on day one of your campaign says nothing about the account's capital cycle.
Weak handoffs: Marketing passes engagement to sales as an endpoint, rather than giving sales the account context, trigger, stakeholders, and next action.
That last failure creates a familiar dashboard. Marketing reports account engagement. Sales sees one contact who downloaded a document. Nobody can explain why the account should move now.
For teams reviewing manufacturing lead generation, the practical fix is signal-triggered intake. An account stays in monitoring until a defined operational event appears, then enrichment, messaging, and sales coverage begin.
Practical rule: An account shouldn't enter an active sequence merely because it matches your ICP. It should enter when fit and timing create a credible buying window.
Targeted manufacturer outbound campaigns can be useful, provided the campaign begins with account evidence rather than a spreadsheet export. The system should answer three questions before the first touch: what changed, who cares, and why now?
Building target account lists from closed-won deals
The first step isn't building a list. It's reverse-engineering the accounts that already bought.
Pull the last 20 to 30 closed-won accounts, then inspect what was true before the first meeting. Review CRM notes, call recordings, proposals, plant locations, leadership changes, project announcements, and lost-deal context. Firmographics are the floor. Your useful criteria usually sit in the operational details salespeople remember but databases don't capture.
Start with compound evidence
One industrial equipment client initially described its market as industrial manufacturers with 200 to 1,000 employees across DACH and CEE. That produced roughly 2,400 accounts, but the list had little relationship to active buying intent.
Reverse-engineering closed-won deals revealed a tighter pattern. Buyers had announced a capacity expansion, such as a new line, plant, or shift, within the prior 9 months, and a plant or operations executive had been in post for less than 18 months.
The two signals mattered together. Expansion indicated a live project. A recently appointed executive indicated someone had a mandate to change performance and a reason to prove progress. Applying both criteria reduced the list to 187 accounts, discarding 92% of the original qualified list. Those accounts produced 78 qualified opportunities and 16 closes, with an average deal size of €148k, according to the client program data supplied for this analysis.
That's the standard to aim for. Your target list should resemble the accounts you've won, not the entire market that could theoretically buy.
Tier accounts by evidence, not enthusiasm
Use four signal dimensions, then assign an account tier based on the evidence available:
Signal dimension | Tier 1, 3+ signals | Tier 2, 2 signals | Tier 3, monitor |
|---|---|---|---|
Operational change | Expansion plus a facility, equipment, or production event | One verified operational event | No current project evidence |
Leadership | New operations, engineering, or procurement leader | Relevant leadership movement | Stable leadership |
Financial context | Contract win, funding, or visible investment pressure | One financial indicator | No confirmed financial change |
Technology gap | Legacy system or equipment approaching end of life | Suspected replacement need | No validated gap |
Tier 1 accounts earn active research and personalized outreach. Tier 2 accounts receive lighter account development while the team looks for a confirming event. Tier 3 accounts remain in monitoring, because spending sales capacity on an untriggered account is usually premature.
Document the logic in your target account list, including the source, date, confidence, and owner for every signal. If a salesperson can't see why an account entered the list, the criteria are too vague.
Detecting operational trigger signals with waterfall enrichment
Manufacturing signals rarely live in one clean database. Expansion plans may appear in municipal permits, regional business journals, trade publications, job postings, earnings commentary, or company announcements. Each source has gaps, so a single-source workflow creates false confidence.
A waterfall enrichment stack solves a data coverage problem by checking several sources in sequence. Start with your base account list, then scan for relevant signals across four to six data providers each week. The exact providers depend on region and industry, but the logic stays consistent.
Intent data: Look for account-level research activity and topic interest. Treat it as an early clue, not proof, because offline manufacturing research often won't appear there.
Facility and capex sources: Check permits, expansion announcements, plant investments, and local filings.
Leadership monitoring: Track LinkedIn changes, executive hiring activity, and relevant search announcements.
Financial sources: Review earnings calls, public filings, contract wins, and trade credit information.
Validation: Require confirmation from at least two independent sources before active outreach.
Score recency and relevance separately
A recent plant expansion deserves more attention than an old hiring announcement. A signal tied to the facility where your solution applies also deserves more weight than a corporate-level event with no operational detail.
Store each signal with its date, source, plant or business unit, affected function, and confidence level. Clay can run waterfall enrichment across multiple providers, then write the result into HubSpot or another CRM. Apollo, Sales Navigator, and specialist monitoring sources can support contact discovery, while the CRM remains the system of record.
The point isn't to collect more fields. It's to create a reliable intake decision.
A signal becomes actionable when a human can verify it, explain its relevance, and connect it to a specific stakeholder.
Accounts with one weak signal should wait. Accounts with two corroborated signals can enter research. Accounts with a compound event, clear fit, and identifiable committee deserve active sequencing. Teams building this flow can reference a waterfall enrichment workflow to formalize the handoff between data collection and outreach.
Mapping the manufacturing buying committee across functions
Manufacturing deals usually stall after the champion has agreed there is a problem. The hold-up comes from another function raising an unanswered concern about installation, compliance, integration, budget, or operational risk.
A current benchmark places enterprise buying committees in the 6 to 10 stakeholder range, according to enterprise buying committee benchmarks. For larger manufacturing contracts, broader stakeholder coverage matters more than sending additional messages to the first contact.
Build the matrix around objections
Function | What they protect | Likely objection | Useful proof |
|---|---|---|---|
Plant engineering | Production continuity | “Will installation disrupt output?” | Integration plan, technical validation, site requirements |
Operations | Efficiency and safety | “Can the plant adopt this without downtime?” | Operating workflow, implementation sequence, safety impact |
Procurement | Compliance and cost | “How do we control vendor and commercial risk?” | Commercial terms, supplier documentation, service coverage |
Finance | Payback and budget control | “Does this investment meet our hurdle?” | Facility-level ROI model, cost assumptions, payback logic |
IT or systems | Data and integration | “How will this connect to existing systems?” | Architecture, security documentation, ownership model |
Executive sponsor | Strategic delivery | “Will this help deliver the mandate?” | Business case tied to the announced operational change |
A plant manager and a CFO should not receive the same compliance deck. The plant manager needs evidence about downtime and adoption. Procurement needs supplier documentation and service coverage. Finance needs a model with visible assumptions, while engineering needs proof that the equipment or system fits the existing environment.
Build one account-plan row for each stakeholder. Include role, influence, current position, objection, trigger relevance, message angle, channel, and next action. Mark the relationship as unknown, contacted, engaged, validated, or championed. CRM visibility exposes missing coverage instead of leaving the committee inside an account executive's notes.
Use how to map your buying committee to structure the people and motivations involved. Keep account records aligned with the team's buying committee process, so marketing and sales apply the same definitions.
Trigger relevance should shape the map. If a plant expansion created the opportunity, start with the functions that will carry the implementation burden, then identify the people who control commercial approval. This keeps outreach connected to the operational event rather than a generic firmographic list or an always-on cadence.
Start with technical credibility before applying commercial pressure. Early engineering validation gives procurement fewer unresolved questions later. It will not remove every negotiation step, but it reduces avoidable rework and shows where the deal still lacks coverage.
The following video provides a visual reference for thinking about buying roles and internal decision paths.
Running signal-triggered outbound sequences that convert
A generic cadence starts with your calendar. A signal-triggered sequence starts with the account's event.
For the industrial equipment client described earlier, the sequence began when the expansion signal and leadership change were both confirmed. Within 48 hours, the prospect received a short Loom video naming the plant, the expansion, and the operational issue the change could create. The video was not polished. It was specific.
Manufacturing executives tend to respond to evidence that the sender understands the operation. A produced brand video asks the buyer to watch marketing. A rough, 60 to 90-second Loom shows that someone researched the account.
The proposal-stage version of this asset drove a 40% to 60% lift in proposal-to-close conversion and a 9-day median cycle compression, based on the client program data supplied for this article. The same campaign's blended reply rate sat in an 11% to 14% band, with the top triggered segment reaching 14.7%, while the video touch was the highest-replying single step.
Use branches instead of forced persistence
Day | Channel | Format | Trigger dependency | Objective |
|---|---|---|---|---|
0 | Signal-led opener | Confirmed operational event | Establish relevance | |
1-2 | Loom | Personalized video | Plant or leadership context available | Prove account research |
4 | Comment and connect | Relevant public post or profile | Add a familiar channel | |
7 | Value hypothesis | Facility problem can be stated | Test business relevance | |
10 | Call | Sales conversation | Contact or committee role identified | Validate urgency |
14 | One-page ROI model | Facility assumptions available | Give finance a reason to engage | |
21 | Email or LinkedIn | Close or monitor branch | Signal remains active or goes dark | Set the next review point |
The ROI model should stay narrow. Scope it to the facility type, production context, and measurable cost assumption you can defend. Don't send a generic white paper at this stage. White papers work better during technical validation, when engineering or procurement needs documentation.
If the signal disappears, stop the active sequence. Mark the account for monitoring and define the next trigger, such as another capacity announcement, a leadership move, or a quarterly update. Lemlist, Instantly, Smartlead, and HeyReach can handle channel execution, but none of them can compensate for weak intake logic.
Keep the CRM state explicit: signal detected, enriched, committee mapped, sequence active, meeting held, opportunity created, or monitor. A cold email should be one action inside that system, not the system itself.
Measuring ABM impact across long manufacturing sales cycles
Manufacturing ABM should measure account progression, not activity volume. Clicks and form fills can rise while the account remains single-threaded, commercially unqualified, and far from a buying decision.
A benchmark for manufacturing ABM reports that stronger programs reach 85% of buying-committee members, compared with 61% for less mature programs, according to account based marketing benchmarks. The same source reports stronger programs achieving roughly 8% to 12% from account to opportunity, 20% to 33% ACV lift, and 100% to 234% pipeline-velocity lift.
Treat those figures as reference points, not targets to copy blindly. Build the operating dashboard around three layers:
Coverage: Percentage of known committee roles reached, signal-to-first-meeting latency, and stakeholder expansion within the account.
Progression: Movement from engaged account to meeting, opportunity, technical validation, proposal, and commercial approval.
Economics: Sourced and influenced pipeline, CAC, win rate by trigger type, average contract value, and revenue timing.
Attribute the work without rewarding noise
Multi-touch attribution often gives too much credit to the final meeting, proposal, or email reply. That obscures the verified trigger and committee-building work that created the later opportunity.
Use a weighted account model. Give meaningful credit to the verified trigger, first accepted meeting, committee expansion, technical validation, proposal, and closed revenue. Keep sourced and influenced pipeline separate, then review the rules with sales and finance before applying them to budget decisions.
According to the client program data supplied for this analysis, the program produced €2.36M attributed revenue on €192k invested, a 12.3x return, with an average deal value of €148k. The same data records a cycle change from roughly 240 days to 187 days, a 22% compression, as outreach entered during the active project window and proposal-stage communication reduced avoidable delay. Treat this as program-specific evidence, not a benchmark for every manufacturer.
A practical guide to ABM for revenue ops can help connect account stages, CRM ownership, and reporting rules. The CFO needs a clear view of whether signal-based intake finds better-timed accounts, reaches the committee, creates qualified opportunities, and brings revenue forward.
GROU helps B2B teams connect target-account research, LinkedIn content, lead generation, and outbound in one pipeline system, including signal-triggered intake for manufacturing accounts. Visit Grou to review account criteria, enrichment flow, and reporting before adding volume.
This Friday, pull your last 20 to 30 closed-won manufacturing accounts into a sheet. Add the operational events that preceded each deal, then identify the first compound criterion appearing across multiple wins. Do not launch another sequence until that criterion is visible in your CRM.

Pipeline OS Newsletter
Build qualified pipeline
Get weekly tactics to generate demand, improve lead quality, and book more meetings.





Trusted by industry leaders
Trusted by industry leaders
Trusted by industry leaders
Ready to build qualified pipeline?
Ready to build qualified pipeline?
Ready to build qualified pipeline?
Book a call to see if we're the right fit, or take the 2-minute quiz to get a clear starting point.
Book a call to see if we're the right fit, or take the 2-minute quiz to get a clear starting point.
Book a call to see if we're the right fit, or take the 2-minute quiz to get a clear starting point.
" height="30.21639343089746px" id="hfGbXmQR2" width="30.216393430897455px"/></svg>)
Copyright © 2026 – All Right Reserved
Copyright © 2026 – All Right Reserved
Copyright © 2026 – All Right Reserved