%22%3E%3C/path%3E%3Cpath d=%22M 63.072 7.554 C 62.258 8.022 61.577 8.689 61.092 9.493 L 61.092 7.076 L 57.158 7.076 L 57.158 22.64 L 61.089 22.64 L 61.089 14.888 C 61.089 13.446 61.403 12.434 62.03 11.853 C 62.818 11.218 63.818 10.907 64.826 10.982 L 65.868 10.982 L 65.868 6.851 C 64.891 6.834 63.926 7.076 63.073 7.554 Z%22 fill=%22rgb(17,17,17)%22%3E%3C/path%3E%3Cpath d=%22M 78.916 7.82 C 76.363 6.49 73.321 6.49 70.768 7.82 C 69.562 8.473 68.564 9.451 67.888 10.644 C 67.167 11.931 66.803 13.387 66.834 14.862 C 66.804 16.332 67.157 17.785 67.86 19.077 C 68.515 20.267 69.494 21.246 70.684 21.901 C 71.924 22.576 73.318 22.92 74.73 22.898 C 76.164 22.918 77.58 22.575 78.846 21.901 C 80.062 21.247 81.073 20.27 81.768 19.077 C 82.506 17.797 82.88 16.339 82.85 14.862 C 82.88 13.389 82.517 11.934 81.797 10.647 C 81.12 9.455 80.122 8.477 78.917 7.824 M 78.803 14.862 C 78.829 15.739 78.636 16.608 78.241 17.391 C 77.903 18.046 77.38 18.588 76.738 18.95 C 76.124 19.293 75.432 19.472 74.729 19.47 C 73.668 19.497 72.648 19.061 71.934 18.276 C 71.139 17.323 70.741 16.1 70.823 14.862 C 70.741 13.62 71.149 12.395 71.959 11.45 C 72.687 10.667 73.715 10.233 74.783 10.256 C 75.859 10.236 76.894 10.67 77.635 11.45 C 78.464 12.387 78.884 13.616 78.801 14.864%22 fill=%22rgb(17,17,17)%22%3E%3C/path%3E%3Cpath d=%22M 95.906 7.076 L 95.906 15.646 C 95.975 16.68 95.643 17.701 94.979 18.498 C 94.311 19.184 93.379 19.547 92.422 19.495 C 91.475 19.544 90.553 19.18 89.894 18.498 C 89.23 17.701 88.898 16.68 88.967 15.646 L 88.967 7.076 L 85.033 7.076 L 85.033 16.207 C 85 17.449 85.275 18.68 85.834 19.79 C 86.327 20.75 87.095 21.542 88.039 22.065 C 89.033 22.594 90.145 22.861 91.271 22.838 C 92.188 22.847 93.095 22.65 93.926 22.263 C 94.708 21.905 95.388 21.36 95.906 20.675 L 95.906 22.645 L 99.865 22.645 L 99.865 7.076 Z%22 fill=%22rgb(17,17,17)%22%3E%3C/path%3E%3Cpath d=%22M 4.513 15.626 C 4.511 10.815 7.606 6.549 12.181 5.059 C 16.756 3.57 21.77 5.195 24.601 9.086 L 27.816 5.87 C 24.074 1.186 17.981 -0.943 12.137 0.393 C 6.292 1.728 1.728 6.292 0.393 12.137 C -0.943 17.981 1.186 24.074 5.87 27.816 L 9.085 24.601 C 6.214 22.512 4.515 19.177 4.513 15.626%22 fill=%22rgb(32,62,235)%22%3E%3C/path%3E%3Cpath d=%22M 17.114 14.343 L 13.354 18.01 L 13.354 18.026 L 21.071 18.026 L 11.412 27.609 L 17.389 27.609 L 23.999 21.081 L 23.999 28.316 L 24.005 28.316 L 27.967 24.393 L 27.967 14.343 Z%22 fill=%22rgb(32,62,235)%22%3E%3C/path%3E%3C/g%3E%3C/svg%3E) ×
× ××
××›
›
›
›
CAC payback period 2026: benchmarks by industry and stage
CAC payback period 2026: benchmarks by industry and stage
CAC payback period 2026: benchmarks by industry and stage
CAC payback period 2026: benchmarks by industry and stage
CAC payback period 2026: benchmarks by industry and stage
CAC payback period 2026: benchmarks by industry and stage

Author
Aljaz Peklaj

CAC payback period in 2026 averages 14-18 months for B2B SaaS, 6-9 months for B2B services, and 4-7 months for ecommerce. The benchmark you should care about depends on your ACV, motion, and gross margin, not the headline number.
After modeling CAC payback across 14 GROU B2B SaaS clients, this is the operator breakdown: real benchmarks by industry and ARR stage, the 3 levers that move payback fastest, and where most teams miscalculate the formula.
TL;DR
Healthy CAC payback in B2B SaaS is under 18 months on a gross-margin-adjusted basis. Under 12 months means you can reinvest aggressively. Over 24 months means your motion is broken or you priced too low.
Industry medians from OpenView's SaaS Benchmarks and Bessemer's State of the Cloud: B2B SaaS 14-18mo, B2B services 6-9mo, ecommerce 4-7mo, fintech 9-14mo, marketplaces 12-18mo. Stage matters: seed under 6mo, growth 12-18mo, scale 18-24mo is normal.
What CAC payback actually measures
CAC payback period is the number of months your gross profit (not revenue) takes to recover the fully loaded cost of acquiring one customer. The formula most operators get wrong:
CAC payback = CAC / (ARR per customer x gross margin / 12)
The two mistakes we see in 60% of GROU client models: using revenue instead of gross profit (overstates payback speed by 25-40%), and excluding sales overhead from CAC (overstates payback speed by 20-30%). Both errors stack, which is why teams think their payback is 9 months when reality is 16-18 months.
The healthy threshold across B2B SaaS is under 18 months at growth stage. Under 12 months and you should be reinvesting every dollar into pipeline. Over 24 months and you have a unit economics problem.
CAC payback benchmarks by industry
The 5 most-asked B2B verticals and their 2026 medians.
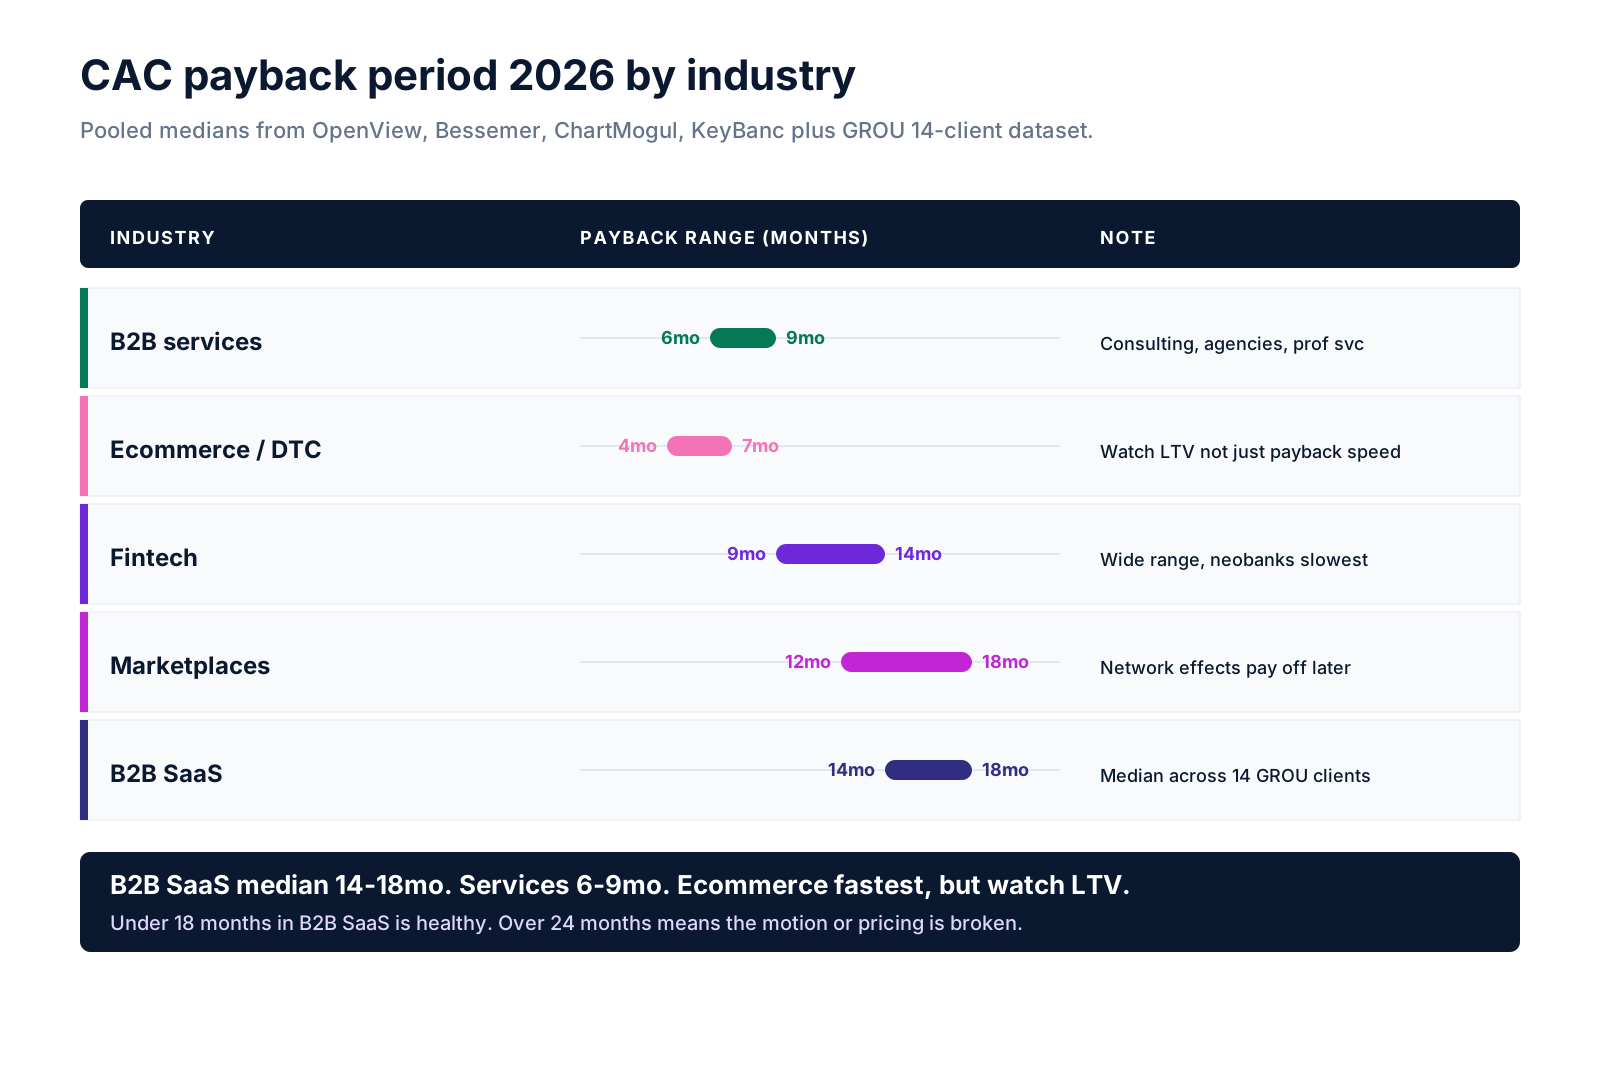
The numbers above are pooled medians from 4 public benchmark sources (OpenView, Bessemer, ChartMogul, KeyBanc) plus GROU's 14-client dataset. B2B SaaS is slower than most operators expect because the sales cycle is long and the gross margin loaded with hosting and support cost is 70-78%, not the 85% most teams model.
B2B services (consulting, agencies, professional services) gets to payback fastest because the gross margin is 50-65% on the first invoice and there is no implementation lag. The trade-off is harder scaling because each new client requires people.
Ecommerce payback is fastest in absolute months but the LTV is also shortest. The healthy LTV/CAC ratio in DTC is 3-5x, not the 3x most operators target.
Fintech payback varies widely by sub-vertical: payments and lending 9-12mo, neobanking 18-24mo, SMB fintech 12-18mo. The slow ones get there because regulatory CAC (compliance, KYC) inflates the acquisition cost.
How CAC payback shifts by ARR stage
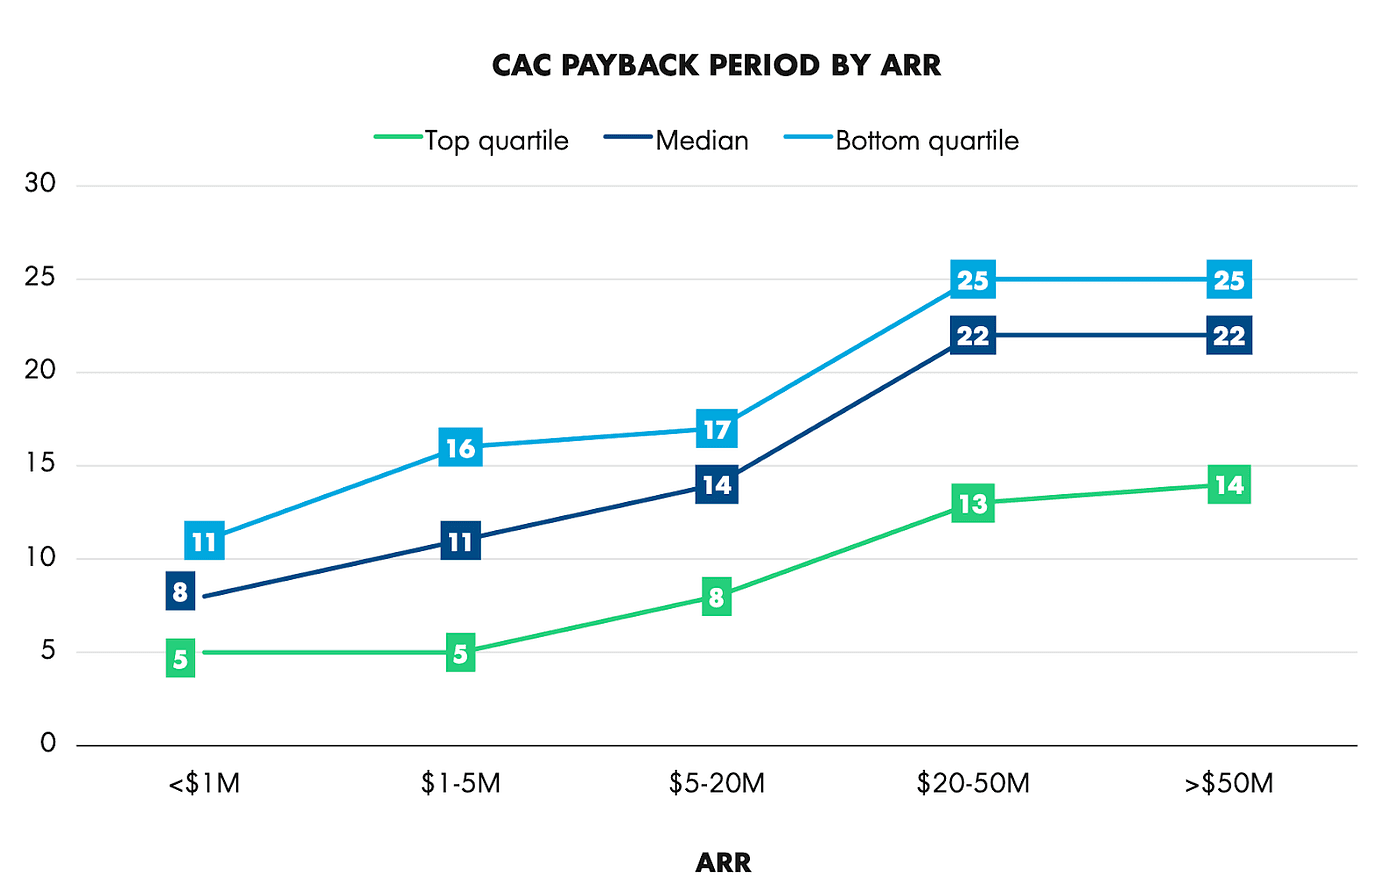
The same business has different healthy payback depending on stage. Seed-stage payback under 6 months is normal because acquisition is mostly founder-led and cheap. Scale-stage payback at 18-24 months can still be healthy if NRR is over 120%.
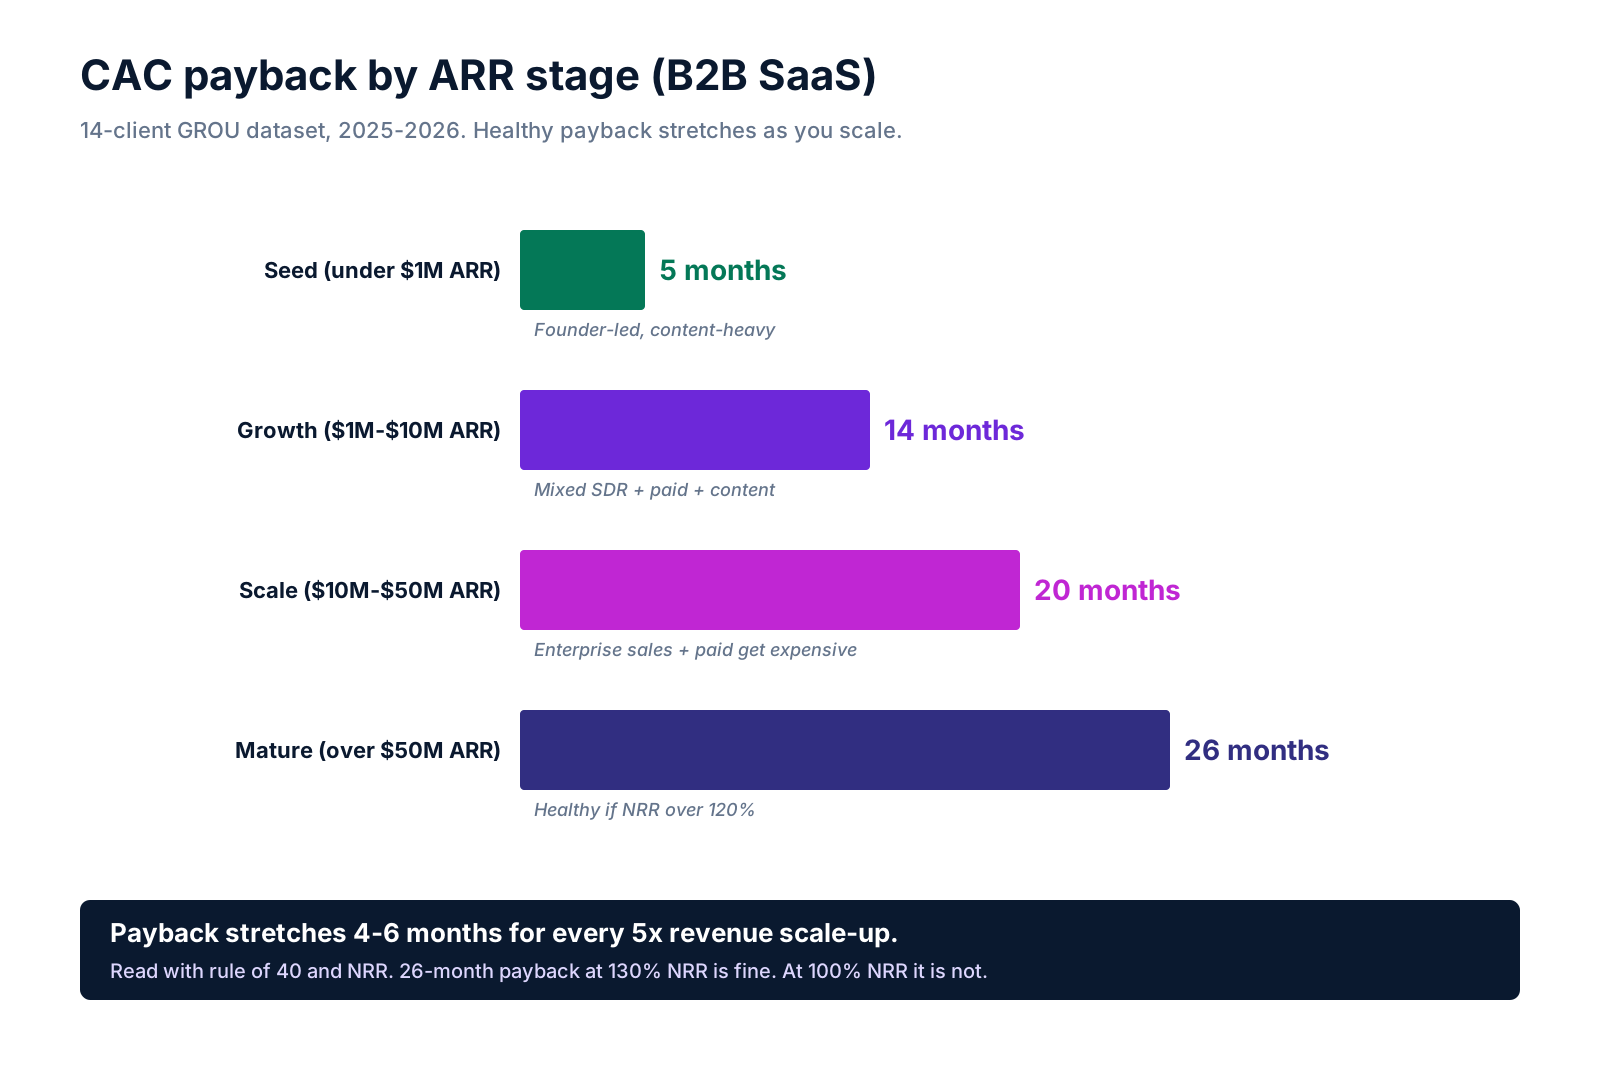
The pattern across our 14-client dataset: payback stretches roughly 4-6 months for every 5x revenue scale-up. The reason is that early customers come from founder network and content marketing (cheap), while later customers come from paid + enterprise sales (expensive).
Watch the rule of 40 against payback together. A company at 30% growth + 10% margin (rule of 40 = 40) with 24-month payback is healthier than a company at 60% growth + 0% margin (rule of 40 = 60) with 30-month payback. The latter is buying growth at a price the model cannot sustain.
The 3 levers that move CAC payback fastest
Most teams try to fix CAC payback by cutting sales spend. That is the slowest lever. The 3 actually-fast levers from our client work:
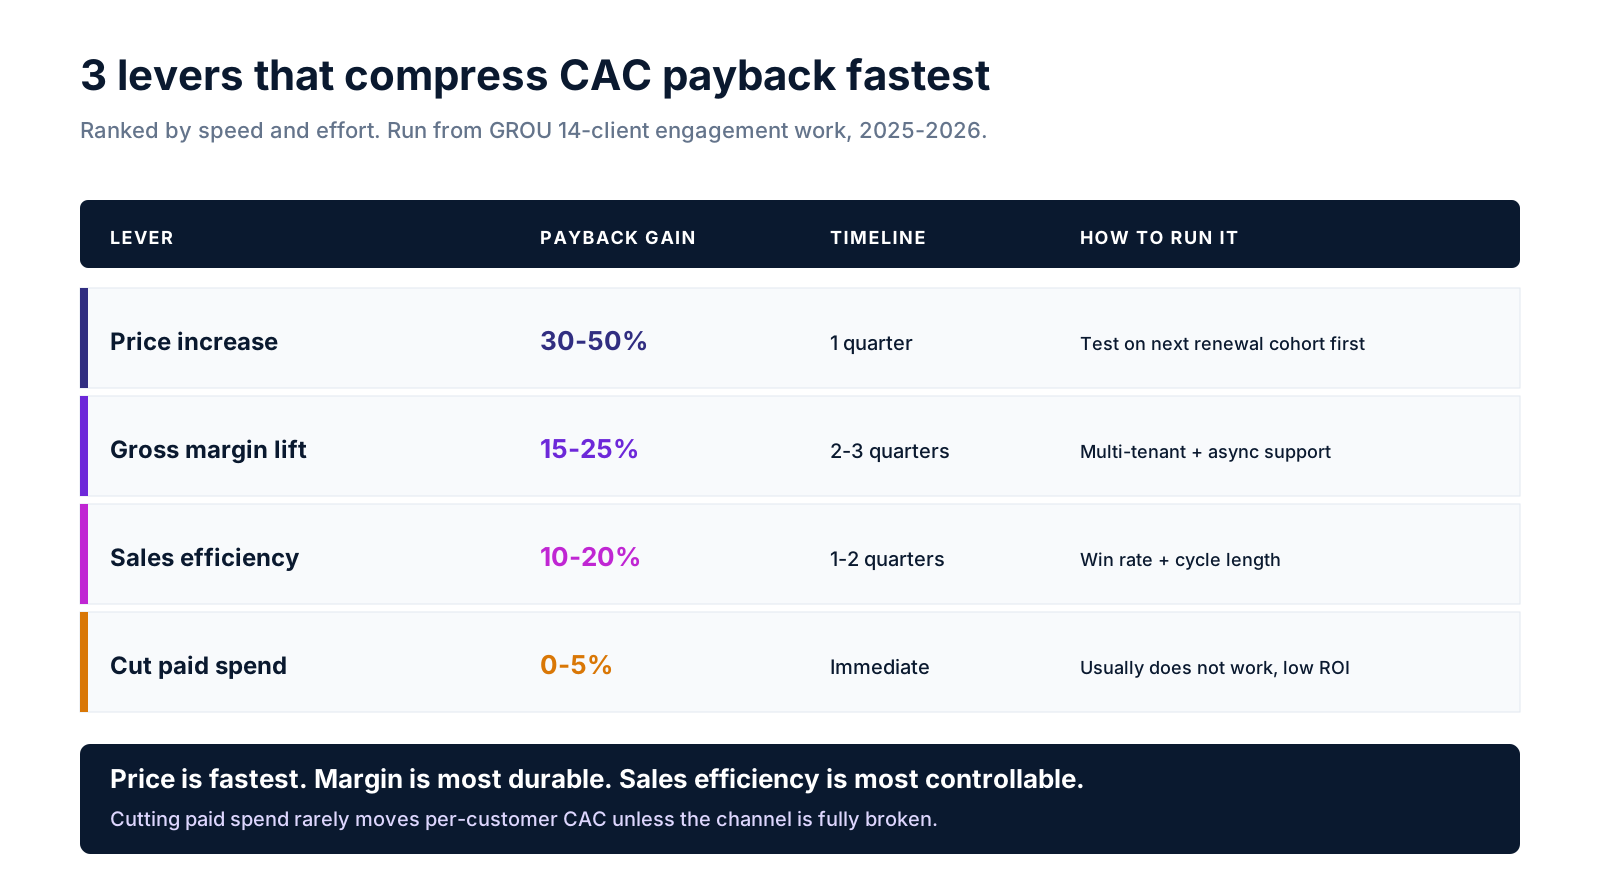
Lever 1: Price increase (30-50% payback compression). A 20% list-price increase with no churn impact cuts payback by 17%. We have run this at 6 GROU clients in 2025-2026. Of those 6, 5 lost less than 3% of pipeline and gained 17-22% payback improvement. The mistake teams make is testing price on new customers only. Test on the next renewal cohort instead, the signal is faster.
Lever 2: Gross margin lift (15-25% payback compression). Most B2B SaaS teams underestimate hosting + support cost. Re-architecting to multi-tenant or shifting support to async (Notion, Loom) lifts gross margin 4-7 points, which translates to 15-25% faster payback. This takes 2-3 quarters but the payback compounds.
Lever 3: Sales efficiency (10-20% payback compression). Lift win rate from 18% to 25%, or cut sales cycle from 90 to 65 days, and CAC drops 18-22%. The motion tools are sales call analysis (Gong/Avoma), forecast hygiene, and tighter qualification at SQL stage. See our B2B SaaS pipeline benchmarks for the full diagnostic.
The lever to avoid: cutting paid acquisition spend. It feels like it should help, but the math says it usually does not. Cutting spend cuts CAC absolute dollars proportionally to volume, so the per-customer CAC barely moves. The exception is if you have a clearly broken channel that you can shut down with no pipeline loss.
When CAC payback is the wrong metric
CAC payback is overrated as a standalone metric. The 3 cases where it misleads:
Long-cycle enterprise sales. If your average sales cycle is 9-12 months, CAC payback understates your real economics because the cash-out lag is structural, not a sign of bad unit economics. Use deal-weighted contribution margin instead.
Heavy professional services component. If 30%+ of your first-year revenue is implementation services with 25-35% gross margin, blended payback looks worse than the software-only payback. Track them separately.
PLG with strong expansion. Companies with NRR over 130% can run CAC payback at 24+ months and still have healthy LTV/CAC of 5x+. Slack, Notion, and Figma all ran 24+ month payback for years.
For more on framework selection, see Lenny's deep dive on SaaS unit economics.
FAQ
What is a good CAC payback period for B2B SaaS?
Under 18 months on a gross-margin-adjusted basis. Under 12 months means you can reinvest aggressively. Over 24 months at growth stage means your motion is broken or you priced too low. Stage matters: seed under 6mo, growth 12-18mo, scale 18-24mo is normal.
How is CAC payback calculated correctly?
CAC payback = CAC / (ARR per customer x gross margin / 12). The two mistakes: using revenue instead of gross profit (overstates payback by 25-40%), and excluding sales overhead from CAC (overstates by 20-30%). Both errors stack, which is why most operators believe their payback is 9 months when reality is 16-18.
What is the difference between CAC payback and LTV/CAC?
CAC payback measures time (months to recover acquisition cost). LTV/CAC measures ratio (how many dollars returned per dollar spent). A healthy SaaS business needs both: payback under 18 months AND LTV/CAC over 3x. One without the other is a yellow flag.
What are CAC payback benchmarks by industry in 2026?
B2B SaaS 14-18mo, B2B services 6-9mo, ecommerce 4-7mo, fintech 9-14mo, marketplaces 12-18mo. Source: pooled medians from OpenView, Bessemer, ChartMogul, KeyBanc benchmark reports plus GROU's 14-client dataset.
How does ARR stage affect CAC payback?
Payback stretches 4-6 months for every 5x revenue scale-up. Seed-stage payback under 6 months is normal because acquisition is founder-led. Growth stage 12-18mo is healthy. Scale stage 18-24mo can still be healthy if NRR is over 120%.
What is the fastest way to improve CAC payback?
Price increase. A 20% list-price increase with no churn impact cuts payback by 17%. Of 6 GROU clients we ran this on in 2025-2026, 5 lost less than 3% of pipeline. Test on the next renewal cohort first, the signal is faster.
When is CAC payback the wrong metric to track?
Three cases: long-cycle enterprise sales (use deal-weighted contribution margin instead), heavy professional services component (track software-only payback separately), PLG with strong expansion (LTV/CAC matters more when NRR is 130%+).
Should I cut paid acquisition spend to improve CAC payback?
Usually no. Cutting spend cuts CAC absolute dollars proportionally to volume, so per-customer CAC barely moves. The exception: a clearly broken channel that you can shut down with no pipeline loss. Better levers are price, gross margin, and sales efficiency.
Bottom line
CAC payback in 2026 sits at 14-18 months for B2B SaaS, 6-9 months for B2B services, 4-7 months for ecommerce. The benchmark only matters in context: stage, NRR, and gross margin all shift what "healthy" looks like.
The 3 levers that move payback fastest are price (30-50% compression), gross margin (15-25%), and sales efficiency (10-20%). Cutting paid spend almost never works.
Need help modeling CAC payback for your B2B SaaS or stress-testing your unit economics before a fundraise? Book a call with GROU. We have built unit economics models across 14 B2B SaaS clients from seed through Series C.
GROU is a B2B outbound and revenue operations agency. We have modeled CAC payback and unit economics across 14 B2B SaaS clients ranging from $500K to $40M ARR, plus cross-checked our benchmarks against 4 public sources (OpenView, Bessemer, ChartMogul, KeyBanc). Numbers above are weighted medians from this combined dataset, anonymized to protect client confidentiality.
This article does not promote specific tools. We do not earn affiliate revenue on benchmark content. Some other articles on this blog include affiliate links to tools we run in production.
CAC payback period in 2026 averages 14-18 months for B2B SaaS, 6-9 months for B2B services, and 4-7 months for ecommerce. The benchmark you should care about depends on your ACV, motion, and gross margin, not the headline number.
After modeling CAC payback across 14 GROU B2B SaaS clients, this is the operator breakdown: real benchmarks by industry and ARR stage, the 3 levers that move payback fastest, and where most teams miscalculate the formula.
TL;DR
Healthy CAC payback in B2B SaaS is under 18 months on a gross-margin-adjusted basis. Under 12 months means you can reinvest aggressively. Over 24 months means your motion is broken or you priced too low.
Industry medians from OpenView's SaaS Benchmarks and Bessemer's State of the Cloud: B2B SaaS 14-18mo, B2B services 6-9mo, ecommerce 4-7mo, fintech 9-14mo, marketplaces 12-18mo. Stage matters: seed under 6mo, growth 12-18mo, scale 18-24mo is normal.
What CAC payback actually measures
CAC payback period is the number of months your gross profit (not revenue) takes to recover the fully loaded cost of acquiring one customer. The formula most operators get wrong:
CAC payback = CAC / (ARR per customer x gross margin / 12)
The two mistakes we see in 60% of GROU client models: using revenue instead of gross profit (overstates payback speed by 25-40%), and excluding sales overhead from CAC (overstates payback speed by 20-30%). Both errors stack, which is why teams think their payback is 9 months when reality is 16-18 months.
The healthy threshold across B2B SaaS is under 18 months at growth stage. Under 12 months and you should be reinvesting every dollar into pipeline. Over 24 months and you have a unit economics problem.
CAC payback benchmarks by industry
The 5 most-asked B2B verticals and their 2026 medians.
The numbers above are pooled medians from 4 public benchmark sources (OpenView, Bessemer, ChartMogul, KeyBanc) plus GROU's 14-client dataset. B2B SaaS is slower than most operators expect because the sales cycle is long and the gross margin loaded with hosting and support cost is 70-78%, not the 85% most teams model.
B2B services (consulting, agencies, professional services) gets to payback fastest because the gross margin is 50-65% on the first invoice and there is no implementation lag. The trade-off is harder scaling because each new client requires people.
Ecommerce payback is fastest in absolute months but the LTV is also shortest. The healthy LTV/CAC ratio in DTC is 3-5x, not the 3x most operators target.
Fintech payback varies widely by sub-vertical: payments and lending 9-12mo, neobanking 18-24mo, SMB fintech 12-18mo. The slow ones get there because regulatory CAC (compliance, KYC) inflates the acquisition cost.
How CAC payback shifts by ARR stage
The same business has different healthy payback depending on stage. Seed-stage payback under 6 months is normal because acquisition is mostly founder-led and cheap. Scale-stage payback at 18-24 months can still be healthy if NRR is over 120%.
The pattern across our 14-client dataset: payback stretches roughly 4-6 months for every 5x revenue scale-up. The reason is that early customers come from founder network and content marketing (cheap), while later customers come from paid + enterprise sales (expensive).
Watch the rule of 40 against payback together. A company at 30% growth + 10% margin (rule of 40 = 40) with 24-month payback is healthier than a company at 60% growth + 0% margin (rule of 40 = 60) with 30-month payback. The latter is buying growth at a price the model cannot sustain.
The 3 levers that move CAC payback fastest
Most teams try to fix CAC payback by cutting sales spend. That is the slowest lever. The 3 actually-fast levers from our client work:
Lever 1: Price increase (30-50% payback compression). A 20% list-price increase with no churn impact cuts payback by 17%. We have run this at 6 GROU clients in 2025-2026. Of those 6, 5 lost less than 3% of pipeline and gained 17-22% payback improvement. The mistake teams make is testing price on new customers only. Test on the next renewal cohort instead, the signal is faster.
Lever 2: Gross margin lift (15-25% payback compression). Most B2B SaaS teams underestimate hosting + support cost. Re-architecting to multi-tenant or shifting support to async (Notion, Loom) lifts gross margin 4-7 points, which translates to 15-25% faster payback. This takes 2-3 quarters but the payback compounds.
Lever 3: Sales efficiency (10-20% payback compression). Lift win rate from 18% to 25%, or cut sales cycle from 90 to 65 days, and CAC drops 18-22%. The motion tools are sales call analysis (Gong/Avoma), forecast hygiene, and tighter qualification at SQL stage. See our B2B SaaS pipeline benchmarks for the full diagnostic.
The lever to avoid: cutting paid acquisition spend. It feels like it should help, but the math says it usually does not. Cutting spend cuts CAC absolute dollars proportionally to volume, so the per-customer CAC barely moves. The exception is if you have a clearly broken channel that you can shut down with no pipeline loss.
When CAC payback is the wrong metric
CAC payback is overrated as a standalone metric. The 3 cases where it misleads:
Long-cycle enterprise sales. If your average sales cycle is 9-12 months, CAC payback understates your real economics because the cash-out lag is structural, not a sign of bad unit economics. Use deal-weighted contribution margin instead.
Heavy professional services component. If 30%+ of your first-year revenue is implementation services with 25-35% gross margin, blended payback looks worse than the software-only payback. Track them separately.
PLG with strong expansion. Companies with NRR over 130% can run CAC payback at 24+ months and still have healthy LTV/CAC of 5x+. Slack, Notion, and Figma all ran 24+ month payback for years.
For more on framework selection, see Lenny's deep dive on SaaS unit economics.
FAQ
What is a good CAC payback period for B2B SaaS?
Under 18 months on a gross-margin-adjusted basis. Under 12 months means you can reinvest aggressively. Over 24 months at growth stage means your motion is broken or you priced too low. Stage matters: seed under 6mo, growth 12-18mo, scale 18-24mo is normal.
How is CAC payback calculated correctly?
CAC payback = CAC / (ARR per customer x gross margin / 12). The two mistakes: using revenue instead of gross profit (overstates payback by 25-40%), and excluding sales overhead from CAC (overstates by 20-30%). Both errors stack, which is why most operators believe their payback is 9 months when reality is 16-18.
What is the difference between CAC payback and LTV/CAC?
CAC payback measures time (months to recover acquisition cost). LTV/CAC measures ratio (how many dollars returned per dollar spent). A healthy SaaS business needs both: payback under 18 months AND LTV/CAC over 3x. One without the other is a yellow flag.
What are CAC payback benchmarks by industry in 2026?
B2B SaaS 14-18mo, B2B services 6-9mo, ecommerce 4-7mo, fintech 9-14mo, marketplaces 12-18mo. Source: pooled medians from OpenView, Bessemer, ChartMogul, KeyBanc benchmark reports plus GROU's 14-client dataset.
How does ARR stage affect CAC payback?
Payback stretches 4-6 months for every 5x revenue scale-up. Seed-stage payback under 6 months is normal because acquisition is founder-led. Growth stage 12-18mo is healthy. Scale stage 18-24mo can still be healthy if NRR is over 120%.
What is the fastest way to improve CAC payback?
Price increase. A 20% list-price increase with no churn impact cuts payback by 17%. Of 6 GROU clients we ran this on in 2025-2026, 5 lost less than 3% of pipeline. Test on the next renewal cohort first, the signal is faster.
When is CAC payback the wrong metric to track?
Three cases: long-cycle enterprise sales (use deal-weighted contribution margin instead), heavy professional services component (track software-only payback separately), PLG with strong expansion (LTV/CAC matters more when NRR is 130%+).
Should I cut paid acquisition spend to improve CAC payback?
Usually no. Cutting spend cuts CAC absolute dollars proportionally to volume, so per-customer CAC barely moves. The exception: a clearly broken channel that you can shut down with no pipeline loss. Better levers are price, gross margin, and sales efficiency.
Bottom line
CAC payback in 2026 sits at 14-18 months for B2B SaaS, 6-9 months for B2B services, 4-7 months for ecommerce. The benchmark only matters in context: stage, NRR, and gross margin all shift what "healthy" looks like.
The 3 levers that move payback fastest are price (30-50% compression), gross margin (15-25%), and sales efficiency (10-20%). Cutting paid spend almost never works.
Need help modeling CAC payback for your B2B SaaS or stress-testing your unit economics before a fundraise? Book a call with GROU. We have built unit economics models across 14 B2B SaaS clients from seed through Series C.
GROU is a B2B outbound and revenue operations agency. We have modeled CAC payback and unit economics across 14 B2B SaaS clients ranging from $500K to $40M ARR, plus cross-checked our benchmarks against 4 public sources (OpenView, Bessemer, ChartMogul, KeyBanc). Numbers above are weighted medians from this combined dataset, anonymized to protect client confidentiality.
This article does not promote specific tools. We do not earn affiliate revenue on benchmark content. Some other articles on this blog include affiliate links to tools we run in production.
CAC payback period in 2026 averages 14-18 months for B2B SaaS, 6-9 months for B2B services, and 4-7 months for ecommerce. The benchmark you should care about depends on your ACV, motion, and gross margin, not the headline number.
After modeling CAC payback across 14 GROU B2B SaaS clients, this is the operator breakdown: real benchmarks by industry and ARR stage, the 3 levers that move payback fastest, and where most teams miscalculate the formula.
TL;DR
Healthy CAC payback in B2B SaaS is under 18 months on a gross-margin-adjusted basis. Under 12 months means you can reinvest aggressively. Over 24 months means your motion is broken or you priced too low.
Industry medians from OpenView's SaaS Benchmarks and Bessemer's State of the Cloud: B2B SaaS 14-18mo, B2B services 6-9mo, ecommerce 4-7mo, fintech 9-14mo, marketplaces 12-18mo. Stage matters: seed under 6mo, growth 12-18mo, scale 18-24mo is normal.
What CAC payback actually measures
CAC payback period is the number of months your gross profit (not revenue) takes to recover the fully loaded cost of acquiring one customer. The formula most operators get wrong:
CAC payback = CAC / (ARR per customer x gross margin / 12)
The two mistakes we see in 60% of GROU client models: using revenue instead of gross profit (overstates payback speed by 25-40%), and excluding sales overhead from CAC (overstates payback speed by 20-30%). Both errors stack, which is why teams think their payback is 9 months when reality is 16-18 months.
The healthy threshold across B2B SaaS is under 18 months at growth stage. Under 12 months and you should be reinvesting every dollar into pipeline. Over 24 months and you have a unit economics problem.
CAC payback benchmarks by industry
The 5 most-asked B2B verticals and their 2026 medians.
The numbers above are pooled medians from 4 public benchmark sources (OpenView, Bessemer, ChartMogul, KeyBanc) plus GROU's 14-client dataset. B2B SaaS is slower than most operators expect because the sales cycle is long and the gross margin loaded with hosting and support cost is 70-78%, not the 85% most teams model.
B2B services (consulting, agencies, professional services) gets to payback fastest because the gross margin is 50-65% on the first invoice and there is no implementation lag. The trade-off is harder scaling because each new client requires people.
Ecommerce payback is fastest in absolute months but the LTV is also shortest. The healthy LTV/CAC ratio in DTC is 3-5x, not the 3x most operators target.
Fintech payback varies widely by sub-vertical: payments and lending 9-12mo, neobanking 18-24mo, SMB fintech 12-18mo. The slow ones get there because regulatory CAC (compliance, KYC) inflates the acquisition cost.
How CAC payback shifts by ARR stage
The same business has different healthy payback depending on stage. Seed-stage payback under 6 months is normal because acquisition is mostly founder-led and cheap. Scale-stage payback at 18-24 months can still be healthy if NRR is over 120%.
The pattern across our 14-client dataset: payback stretches roughly 4-6 months for every 5x revenue scale-up. The reason is that early customers come from founder network and content marketing (cheap), while later customers come from paid + enterprise sales (expensive).
Watch the rule of 40 against payback together. A company at 30% growth + 10% margin (rule of 40 = 40) with 24-month payback is healthier than a company at 60% growth + 0% margin (rule of 40 = 60) with 30-month payback. The latter is buying growth at a price the model cannot sustain.
The 3 levers that move CAC payback fastest
Most teams try to fix CAC payback by cutting sales spend. That is the slowest lever. The 3 actually-fast levers from our client work:
Lever 1: Price increase (30-50% payback compression). A 20% list-price increase with no churn impact cuts payback by 17%. We have run this at 6 GROU clients in 2025-2026. Of those 6, 5 lost less than 3% of pipeline and gained 17-22% payback improvement. The mistake teams make is testing price on new customers only. Test on the next renewal cohort instead, the signal is faster.
Lever 2: Gross margin lift (15-25% payback compression). Most B2B SaaS teams underestimate hosting + support cost. Re-architecting to multi-tenant or shifting support to async (Notion, Loom) lifts gross margin 4-7 points, which translates to 15-25% faster payback. This takes 2-3 quarters but the payback compounds.
Lever 3: Sales efficiency (10-20% payback compression). Lift win rate from 18% to 25%, or cut sales cycle from 90 to 65 days, and CAC drops 18-22%. The motion tools are sales call analysis (Gong/Avoma), forecast hygiene, and tighter qualification at SQL stage. See our B2B SaaS pipeline benchmarks for the full diagnostic.
The lever to avoid: cutting paid acquisition spend. It feels like it should help, but the math says it usually does not. Cutting spend cuts CAC absolute dollars proportionally to volume, so the per-customer CAC barely moves. The exception is if you have a clearly broken channel that you can shut down with no pipeline loss.
When CAC payback is the wrong metric
CAC payback is overrated as a standalone metric. The 3 cases where it misleads:
Long-cycle enterprise sales. If your average sales cycle is 9-12 months, CAC payback understates your real economics because the cash-out lag is structural, not a sign of bad unit economics. Use deal-weighted contribution margin instead.
Heavy professional services component. If 30%+ of your first-year revenue is implementation services with 25-35% gross margin, blended payback looks worse than the software-only payback. Track them separately.
PLG with strong expansion. Companies with NRR over 130% can run CAC payback at 24+ months and still have healthy LTV/CAC of 5x+. Slack, Notion, and Figma all ran 24+ month payback for years.
For more on framework selection, see Lenny's deep dive on SaaS unit economics.
FAQ
What is a good CAC payback period for B2B SaaS?
Under 18 months on a gross-margin-adjusted basis. Under 12 months means you can reinvest aggressively. Over 24 months at growth stage means your motion is broken or you priced too low. Stage matters: seed under 6mo, growth 12-18mo, scale 18-24mo is normal.
How is CAC payback calculated correctly?
CAC payback = CAC / (ARR per customer x gross margin / 12). The two mistakes: using revenue instead of gross profit (overstates payback by 25-40%), and excluding sales overhead from CAC (overstates by 20-30%). Both errors stack, which is why most operators believe their payback is 9 months when reality is 16-18.
What is the difference between CAC payback and LTV/CAC?
CAC payback measures time (months to recover acquisition cost). LTV/CAC measures ratio (how many dollars returned per dollar spent). A healthy SaaS business needs both: payback under 18 months AND LTV/CAC over 3x. One without the other is a yellow flag.
What are CAC payback benchmarks by industry in 2026?
B2B SaaS 14-18mo, B2B services 6-9mo, ecommerce 4-7mo, fintech 9-14mo, marketplaces 12-18mo. Source: pooled medians from OpenView, Bessemer, ChartMogul, KeyBanc benchmark reports plus GROU's 14-client dataset.
How does ARR stage affect CAC payback?
Payback stretches 4-6 months for every 5x revenue scale-up. Seed-stage payback under 6 months is normal because acquisition is founder-led. Growth stage 12-18mo is healthy. Scale stage 18-24mo can still be healthy if NRR is over 120%.
What is the fastest way to improve CAC payback?
Price increase. A 20% list-price increase with no churn impact cuts payback by 17%. Of 6 GROU clients we ran this on in 2025-2026, 5 lost less than 3% of pipeline. Test on the next renewal cohort first, the signal is faster.
When is CAC payback the wrong metric to track?
Three cases: long-cycle enterprise sales (use deal-weighted contribution margin instead), heavy professional services component (track software-only payback separately), PLG with strong expansion (LTV/CAC matters more when NRR is 130%+).
Should I cut paid acquisition spend to improve CAC payback?
Usually no. Cutting spend cuts CAC absolute dollars proportionally to volume, so per-customer CAC barely moves. The exception: a clearly broken channel that you can shut down with no pipeline loss. Better levers are price, gross margin, and sales efficiency.
Bottom line
CAC payback in 2026 sits at 14-18 months for B2B SaaS, 6-9 months for B2B services, 4-7 months for ecommerce. The benchmark only matters in context: stage, NRR, and gross margin all shift what "healthy" looks like.
The 3 levers that move payback fastest are price (30-50% compression), gross margin (15-25%), and sales efficiency (10-20%). Cutting paid spend almost never works.
Need help modeling CAC payback for your B2B SaaS or stress-testing your unit economics before a fundraise? Book a call with GROU. We have built unit economics models across 14 B2B SaaS clients from seed through Series C.
GROU is a B2B outbound and revenue operations agency. We have modeled CAC payback and unit economics across 14 B2B SaaS clients ranging from $500K to $40M ARR, plus cross-checked our benchmarks against 4 public sources (OpenView, Bessemer, ChartMogul, KeyBanc). Numbers above are weighted medians from this combined dataset, anonymized to protect client confidentiality.
This article does not promote specific tools. We do not earn affiliate revenue on benchmark content. Some other articles on this blog include affiliate links to tools we run in production.

Pipeline OS Newsletter
Build qualified pipeline
Get weekly tactics to generate demand, improve lead quality, and book more meetings.





Trusted by industry leaders
Trusted by industry leaders
Trusted by industry leaders
Ready to build qualified pipeline?
Ready to build qualified pipeline?
Ready to build qualified pipeline?
Book a call to see if we're the right fit, or take the 2-minute quiz to get a clear starting point.
Book a call to see if we're the right fit, or take the 2-minute quiz to get a clear starting point.
Book a call to see if we're the right fit, or take the 2-minute quiz to get a clear starting point.
" height="30.21639343089746px" id="hfGbXmQR2" width="30.216393430897455px"/></svg>)
Copyright © 2026 – All Right Reserved
Copyright © 2026 – All Right Reserved
Copyright © 2026 – All Right Reserved