›
›
›
›
Flow chart of sales process: A B2B operator's guide
Flow chart of sales process: A B2B operator's guide
Flow chart of sales process: A B2B operator's guide
Flow chart of sales process: A B2B operator's guide
Flow chart of sales process: A B2B operator's guide
Flow chart of sales process: A B2B operator's guide

Author
Aljaz Peklaj

Most advice on a flow chart of sales process is wrong in the same way. It gives you a neat line from lead to close, then acts surprised when reps work around it, forecasts miss, and “stalled” becomes a permanent deal stage.
B2B sales doesn't move in a clean line. Buyers pause, champions disappear, procurement shows up late, legal re-routes timing, and bad-fit accounts should exit early. If your chart only shows the forward path, it's not a process. It's a sales fantasy.
At GROU, we treat the chart as an operating tool. It has to tell a rep what to do next, what must be true before a deal advances, and where the deal goes when the answer is no. If it can't do that, it belongs in a deck, not in HubSpot.
TL;DR
Map decisions, not just stages → the actual value is in gates, exits, and loop-backs
Use six core stages → but make the branches between them explicit and enforceable
Draft messy in Miro, then operationalize in HubSpot → if the CRM doesn't match the chart, the chart is decoration
Design for non-linear buying → actual B2B deals split across stakeholders, approvals, and delays
Validate against real deals → if reps route around the chart, the chart is wrong
Table of Contents
Your sales process flow chart is a fantasy
The most popular sales diagrams fail for one simple reason. They document what leadership wishes happened, not what reps and buyers do.
A typical chart says lead → discovery → proposal → negotiation → close. It looks tidy. It also ignores disqualification, silence, re-engagement, missing stakeholders, and the fact that half the damage happens at the forks, not in the boxes.

The happy path is the least useful part
The happy path is obvious. Everyone knows what happens when a qualified buyer replies fast, shows up prepared, approves budget, and signs.
That's not where process design earns its keep. The chart matters when someone opens but doesn't reply, when a rep wants to force-stage a weak opportunity, or when a proposal gets acknowledged verbally but never in writing. Those are the moments that wreck conversion data and forecast quality.
This is also why a lot of lead conversion problems aren't really messaging problems. They're routing and qualification problems. A weak process lets bad-fit accounts drift too far downstream, which looks like a top-of-funnel issue when it's really a stage-control issue. If that sounds familiar, this breakdown of why leads aren't converting and how to fix it is worth reading alongside your chart.
A flow chart of sales process should answer one hard question at every point, what happens if the answer is no?
What a real chart has to do
A real chart has three jobs:
Define entry criteria → what must be true before a record enters the stage
Define exit criteria → what evidence allows it to move forward
Define failure paths → nurture, recycle, disqualify, stall management, or leadership escalation
If one of those is missing, reps fill the gap themselves. Once that happens, your CRM becomes a storytelling tool instead of an operating system.
The shift in modern sales flowcharts has been away from static stage lists and toward management systems that improve handoffs and predictability in long B2B cycles, as described in Clari's view of sales process flowcharts as forecasting and governance tools. That's the right direction. A chart should govern movement, not just describe it.
The 6 core stages and their decision gates
Instead of adding more stages, teams typically need stricter gates.
The six stages below are the version we keep coming back to because they're practical in outbound-heavy B2B motions, especially when Apollo, Clay, Lemlist, Instantly, HeyReach, Sales Navigator, and HubSpot are all touching the same pipeline. The structure is simple enough to run, but hard enough to stop fake progression.
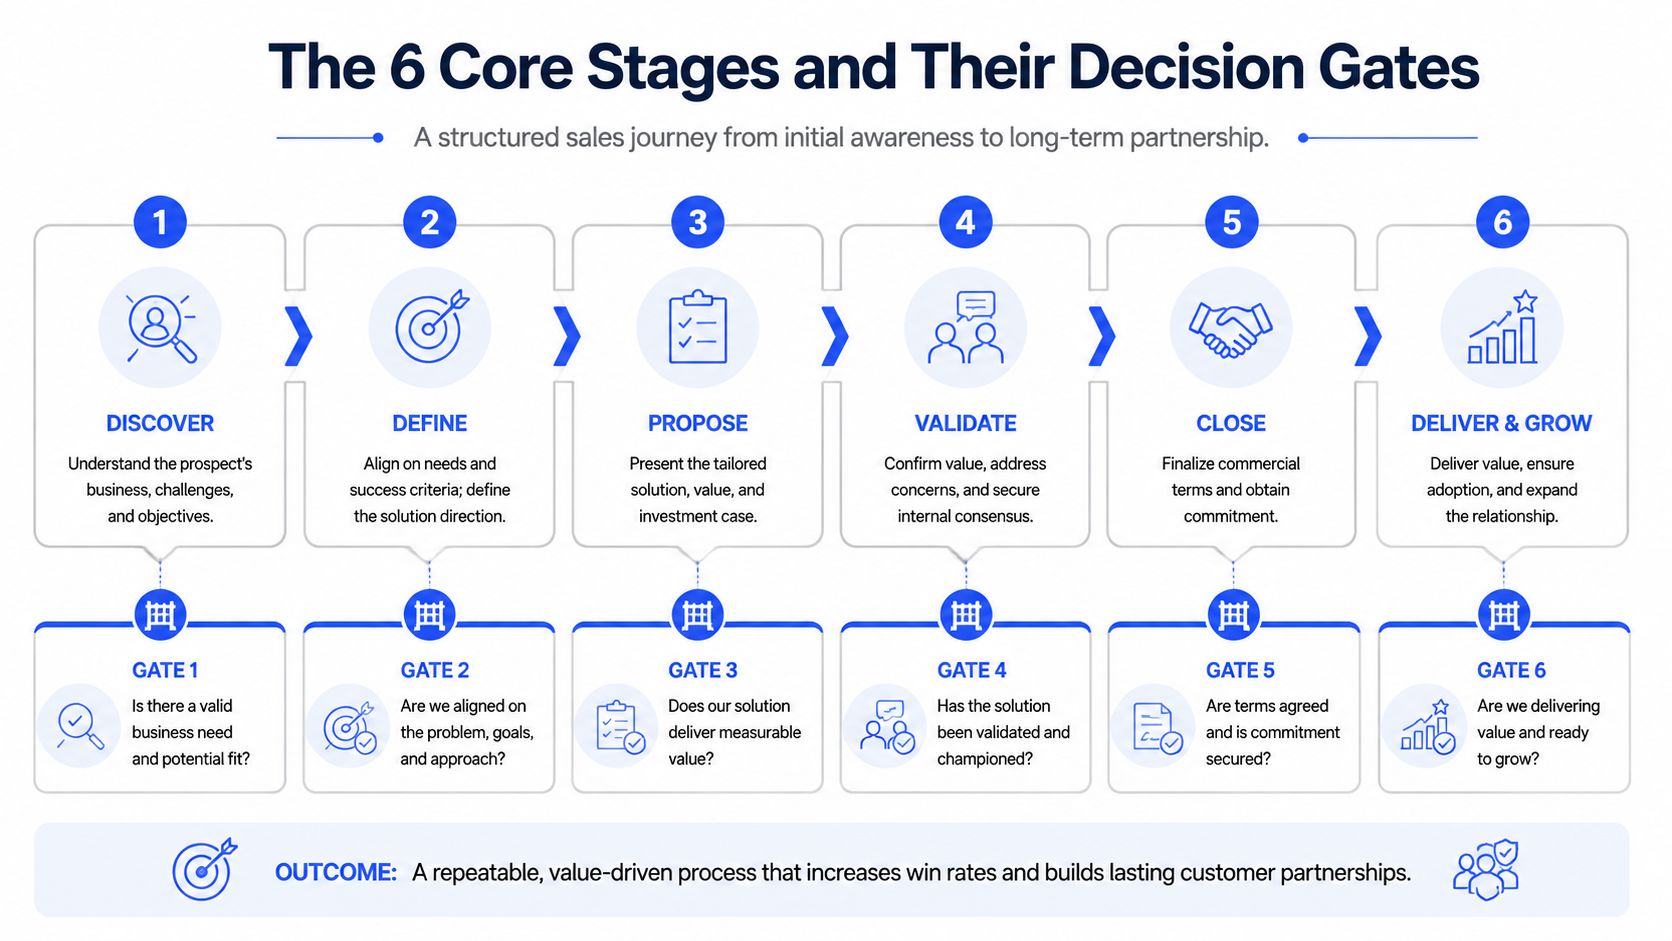
The six-stage framework
Lead in
This starts when source is captured and the account hits the system. Before anything else, run an ICP fit check.
If it fits, enrich and route it forward. If it doesn't, send it to nurture or disqualify it. No exceptions. Teams that “let reps decide later” usually just defer bad data downstream.
Contacted
Now the account enters first touch. This is multi-channel in practice, email, LinkedIn, sometimes phone, and the sequence logic should already be set by account type and persona.
The fork here is simple. Engaged goes forward. No engagement after the full sequence goes to recycle for future re-engagement. Don't leave dead air records sitting in active pipeline.
Qualified
This is the stage most teams pretend is happening while reps are really just booking meetings. Qualification needs three explicit gates: pain confirmed, budget in range, authority present.
Pass the gate and move to proposal. Fail two of the three and move back to nurture. That rule keeps sympathy pipeline from contaminating forecast pipeline.
Proposal
A proposal stage without an acknowledgment rule is where charts get sloppy. “Proposal sent” is not a milestone. It's an action.
The gate is written acknowledgment. If the buyer acknowledges scope in writing, move to negotiation. If there's silence after three follow-ups, trigger the stalled-deal playbook instead of pretending the deal is still live.
Negotiation
Objection handling and mutual close planning should happen at this stage, rather than generic chasing.
If you have verbal yes plus a start date, move to closing. If procurement or legal enters, route to a leadership review path. That branch matters because the deal has changed shape and usually timeline too.
Closed
Closed-won means signed contract and handoff to delivery. Closed-lost means loss reason logged and re-engagement timer set.
If you skip mandatory loss logging, you're throwing away the only clean feedback revenue organizations ever get from the market.
Practical rule: Each stage gets one sentence for “what qualifies entry,” one sentence for “what qualifies exit,” and one sentence for “where it goes if no.”
Why these gates matter operationally
Apollo's framework is useful here because it ties named checkpoints to benchmark conversions, including 15-25% from lead to qualified opportunity and 25-35% from proposal to closed-won in qualified pipeline, which is why stage design affects both control and forecasting, not just rep training, as shown in Apollo's guide to sales process flowcharts and checkpoint metrics.
That doesn't mean you copy Apollo's stage names blindly. It means you treat the chart like a control system. Every box needs a milestone. Every arrow implies a qualification decision. Every stage should be inspectable inside the CRM.
If you're reworking coverage and resourcing around this, especially when SDR work, admin work, and routing are split across people, this piece on optimizing sales processes through external partners has a practical angle on operational ownership.
A useful test is whether your documented flow chart of sales process matches the language in your CRM. If your reps call it “qualified,” your dashboard says “SQL,” and your playbook says “discovery complete,” you don't have stage discipline. You have three competing truths. Tighten the naming and define each deal stage once.
How to design the chart from whiteboard to CRM
Good process design starts ugly. If the first version looks polished, your team probably skipped the arguments that matter.
We use three tools in order because each solves a different problem. Miro is for thinking. Lucidchart or Whimsical is for clean documentation. HubSpot is for reality.
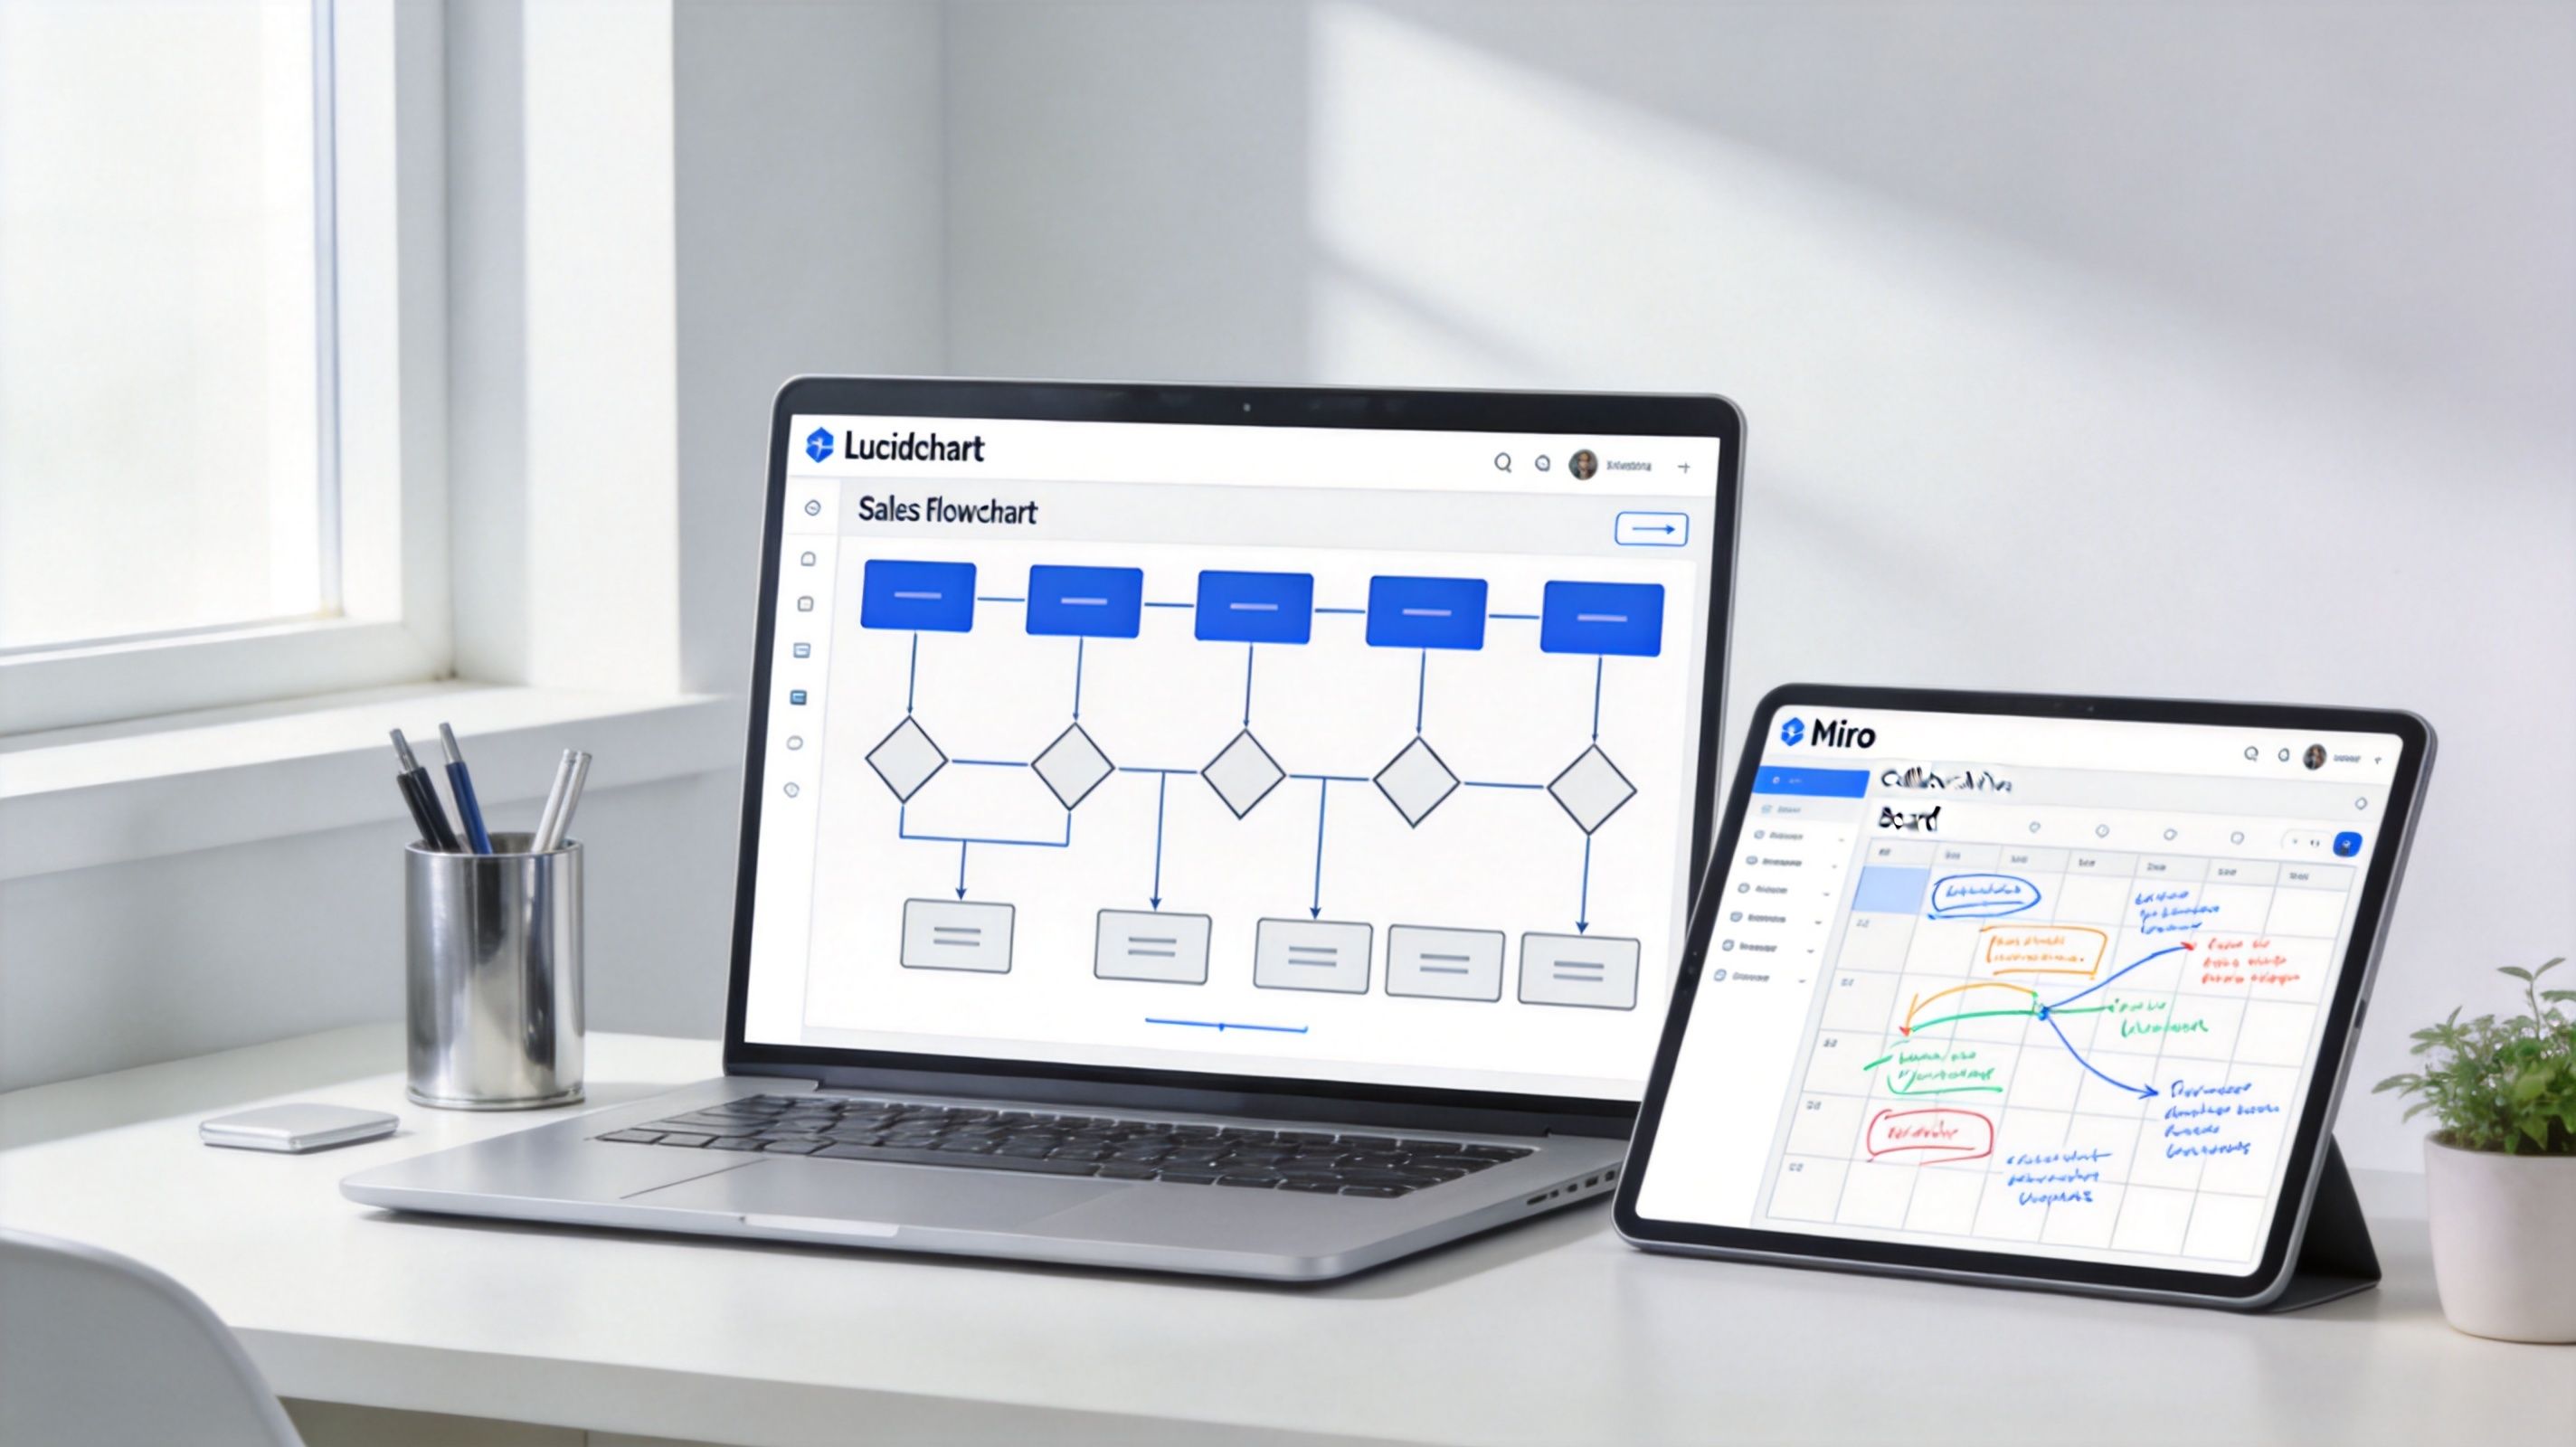
Start messy in Miro
Miro is where you find the missing branches.
On the first pass, don't worry about clean shapes or perfect labels. Pull sales, RevOps, and whoever owns inbound or outbound routing into the same board. Start with sticky notes and ask blunt questions.
Where does a bad-fit lead exit → not in theory, in your actual motion
What counts as engagement → open, click, reply, booked call, or something else
Who owns handoff after reply → SDR, AE, RevOps, or a shared queue
What happens when legal appears → stage move, task creation, or escalation path
This is also where multi-thread complexity shows up. Real B2B buying is not one path. Prospects can say yes, no, or ask for more time or information, and your chart has to account for those branches, which is the useful takeaway from Mural's discussion of sales process mapping for branching buyer behavior.
Don't design one buyer journey. Design the paths your champion, blocker, and signer each create in the deal.
Clean it up, then make it real in HubSpot
Once the logic settles, rebuild it in Lucidchart or Whimsical with standard shapes. Rounded shapes for start and end. Rectangles for actions. Diamonds for decisions. This version belongs in onboarding and in your playbook.
Then move to the live version. That means HubSpot pipeline stages, required properties, task automation, ownership rules, and clear stage-exit criteria inside the CRM. A flowchart that isn't mirrored in the CRM will drift within weeks.
Use required fields aggressively. If a rep cannot move “Qualified” to “Proposal” without confirming the right data, the process has a chance to hold. If stage movement is free-form, the chart is just a suggestion.
A CRM-specific implementation guide helps more than another generic diagram article here. The Glue Sky CRM strategy guide is useful for translating custom flow logic into CRM structure. If you're mapping this into a broader outbound and reporting setup, CRM integration is the layer that decides whether your chart becomes usable or stays theoretical.
A short walkthrough helps teams visualize the handoff from diagram to daily workflow:
One rule is essential. Keep the chart to one page and make it readable in 30 seconds. If a new rep can't understand the entire motion on one screen, the design is too complex, or the process is.
Visual design that drives action, not confusion
Most sales charts fail visually before they fail operationally. Every box looks the same, the exits are faint, and the decision points disappear into the page.
That's not a cosmetic issue. If reps can't see the forks instantly, they won't use the chart when they're moving fast. A sales flowchart is a decision tool, not a mural.
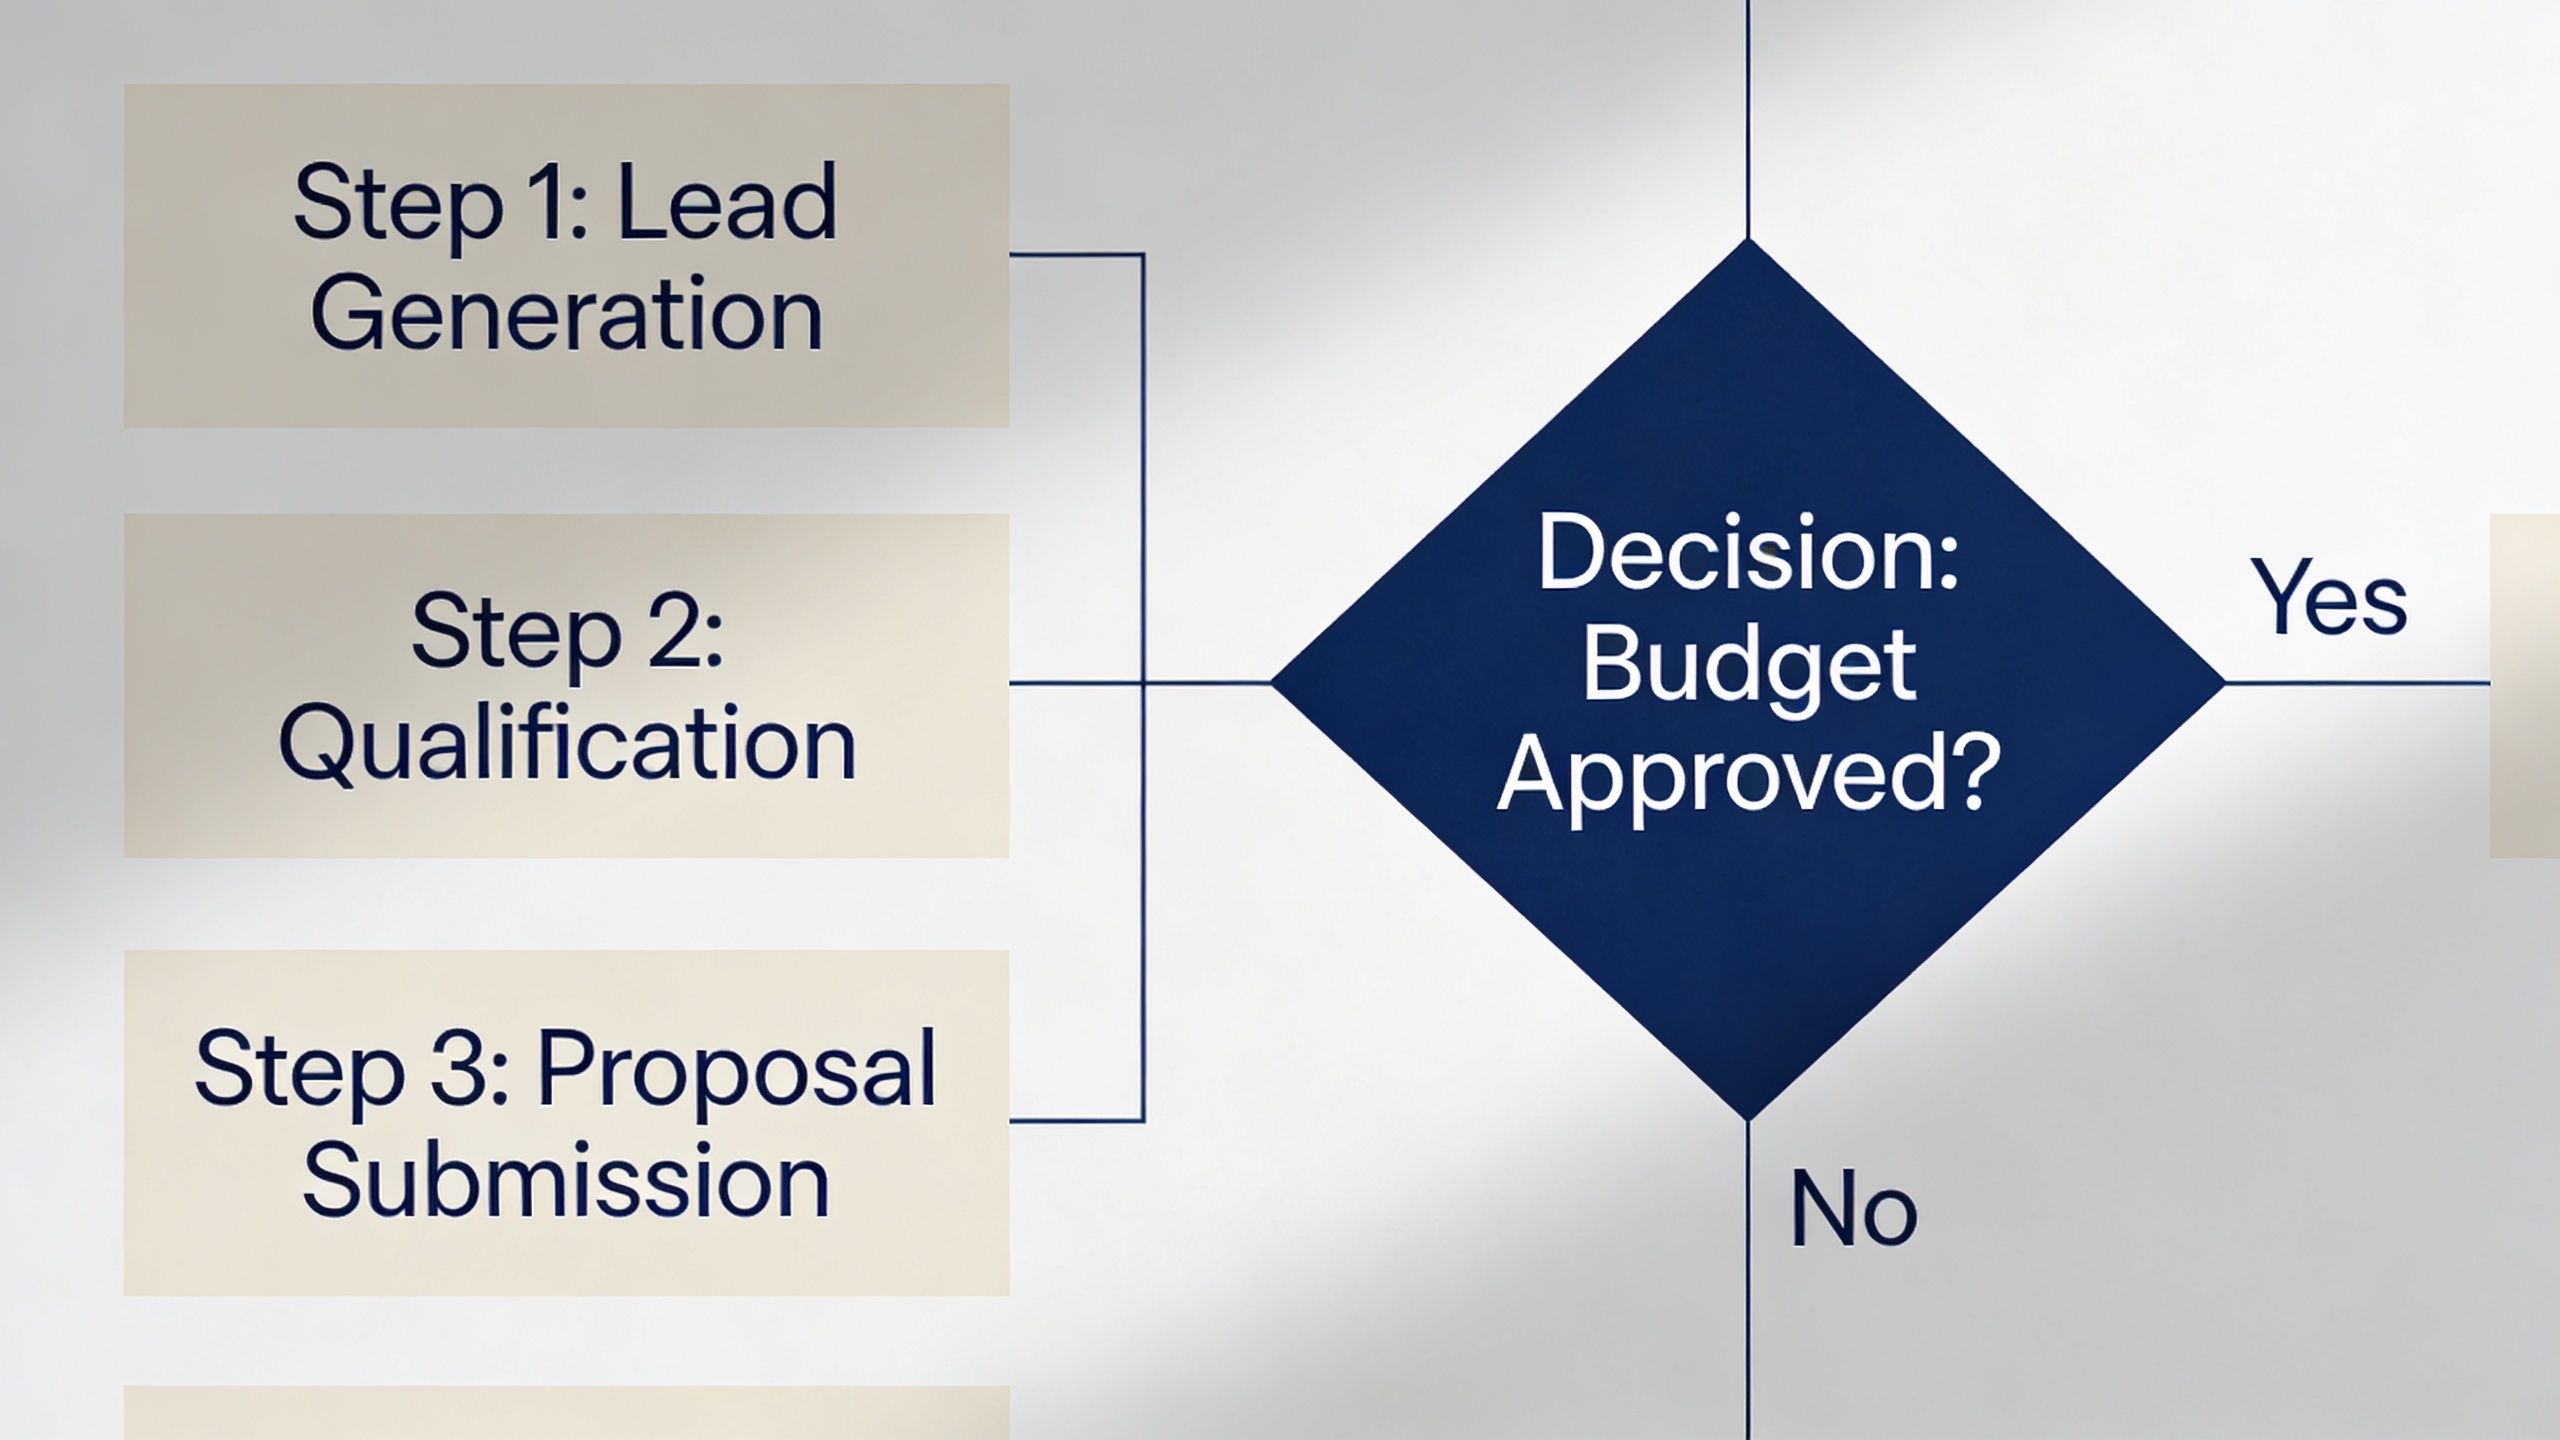
Use visual weight on the decisions
Color-code by function, not by stage. Keep actions in a neutral tone. Use one high-contrast color for every decision diamond.
That does two things. First, the eye can find risk points fast. Second, reps learn that the decisions are the product. The boxes are just the work around them.
Write the actual decision question inside the diamond. Don't make people cross-reference a legend. “Pain confirmed AND budget in range AND authority present?” is stronger than a diamond labeled “Qualify.”
Element | What to do | Why it works |
|---|---|---|
Action boxes | Use one neutral color | Keeps process steps readable |
Decision diamonds | Use one contrasting color | Makes forks visible in seconds |
Start and end points | Use rounded shapes | Clarifies boundaries |
High-risk gate | Add heavier border or callout | Warns reps where deals often break |
Make the exits impossible to miss
Most charts hide the disqualify and loop-back paths in thin grey arrows. That trains reps to ignore them.
Do the opposite. Make exit paths as visible as the forward path. If “not now,” “bad fit,” and “stalled” are real outcomes, they should look real on the page too.
Venngage frames modern sales flowcharts as tools for spotting bottlenecks and making processes scalable, and the useful operational point is that the chart should define where a lead goes minutes after a reply, who qualifies it, and how the feedback loop improves targeting, as outlined in its guide to sales process flowcharts as routing and SLA tools. That's why visual design matters. It changes behavior.
The easiest way to improve a chart is usually not adding detail. It's making the exits and decisions impossible to miss.
If your team already uses a documented visual language for internal assets, treat the chart the same way you'd treat any other design system. Consistency reduces interpretation errors.
How to validate your flowchart with the sales team
A flowchart designed in a workshop is still just a hypothesis. It becomes a process when you test it against real deals and field behavior.
We use three passes. Not because process people like ceremony, but because charts fail in three different ways, logic failure, field rejection, and CRM drift.
Pass 1, replay recent deals
Pull a mixed set of recent opportunities and trace them through the proposed chart. Include won and lost.
Use this review to answer practical questions:
Where did the deal branch → not where the diagram said it should
Which stage was skipped → often qualification or stalled handling
What information appeared too late → budget, authority, procurement, security, legal
Which exit path never existed on paper → nurture, recycle, escalation, or loss logging
This replay quickly exposes the difference between documented stages and lived reality. It also forces the team to define what counts as evidence for stage progression.
Pass 2 and pass 3, field reality beats conference-room logic
Pass 2 is the rep walkthrough. Sit with the people using the process and have them talk through a live deal against the chart. The useful moment is when someone says, “that's not really how this works.” That's not resistance. That's design feedback.
Pass 3 is the 30-day review after launch. Look at where deals pile up, which decision gates are skipped, and whether reps are using the defined exits. If every rep keeps creating workarounds, don't start with enforcement. Start with the assumption that the chart is wrong.
Field signal: When reps avoid an exit path entirely, it usually means the path is unrealistic, hidden, or politically unsafe to use.
Modern sales flowcharts have evolved into management frameworks that track details like deal context and decision-makers at each stage so teams can improve handoffs and predictability in longer B2B cycles. That's the useful takeaway from Clari's broader view of stage-based governance, even if your own implementation is simpler.
Quarterly review matters too. Market changes, ICP changes, and channel mix changes all break old stage logic faster than teams often admit. Treat the chart like a live ops asset, not a one-time project.
Your next step is a 10-deal audit
Don't start by redrawing your whole process.
Start with ten deals. Pull five closed-won and five closed-lost from HubSpot. Then print your current flow chart of sales process, or sketch the one your team claims to follow, and walk every deal through it step by step.
Mark the exact places where reality diverged.
Skipped gate → the rep advanced without the required evidence
Missing branch → the buyer did something your chart doesn't represent
Fake stage progression → the CRM moved forward but the deal did not
Undefined exit → the deal should have been recycled, nurtured, or disqualified earlier
That audit will tell you more than another brainstorming session. It shows where your process is fiction, where your data is getting polluted, and which stage definitions need rewriting first.
If you want a quick benchmark before doing the rebuild, run your team through this pipeline score quiz. It's a simple way to spot whether the issue is stage design, qualification discipline, or handoff control.
If your team needs help turning scattered outbound efforts, CRM stages, and reply handling into one enforceable process, Grou builds pipeline systems around clear routing, qualification rules, and shared reporting. The useful starting point is simple: audit your last ten deals, mark every undocumented branch, then rebuild the chart so HubSpot matches how deals move.
Most advice on a flow chart of sales process is wrong in the same way. It gives you a neat line from lead to close, then acts surprised when reps work around it, forecasts miss, and “stalled” becomes a permanent deal stage.
B2B sales doesn't move in a clean line. Buyers pause, champions disappear, procurement shows up late, legal re-routes timing, and bad-fit accounts should exit early. If your chart only shows the forward path, it's not a process. It's a sales fantasy.
At GROU, we treat the chart as an operating tool. It has to tell a rep what to do next, what must be true before a deal advances, and where the deal goes when the answer is no. If it can't do that, it belongs in a deck, not in HubSpot.
TL;DR
Map decisions, not just stages → the actual value is in gates, exits, and loop-backs
Use six core stages → but make the branches between them explicit and enforceable
Draft messy in Miro, then operationalize in HubSpot → if the CRM doesn't match the chart, the chart is decoration
Design for non-linear buying → actual B2B deals split across stakeholders, approvals, and delays
Validate against real deals → if reps route around the chart, the chart is wrong
Table of Contents
Your sales process flow chart is a fantasy
The most popular sales diagrams fail for one simple reason. They document what leadership wishes happened, not what reps and buyers do.
A typical chart says lead → discovery → proposal → negotiation → close. It looks tidy. It also ignores disqualification, silence, re-engagement, missing stakeholders, and the fact that half the damage happens at the forks, not in the boxes.
The happy path is the least useful part
The happy path is obvious. Everyone knows what happens when a qualified buyer replies fast, shows up prepared, approves budget, and signs.
That's not where process design earns its keep. The chart matters when someone opens but doesn't reply, when a rep wants to force-stage a weak opportunity, or when a proposal gets acknowledged verbally but never in writing. Those are the moments that wreck conversion data and forecast quality.
This is also why a lot of lead conversion problems aren't really messaging problems. They're routing and qualification problems. A weak process lets bad-fit accounts drift too far downstream, which looks like a top-of-funnel issue when it's really a stage-control issue. If that sounds familiar, this breakdown of why leads aren't converting and how to fix it is worth reading alongside your chart.
A flow chart of sales process should answer one hard question at every point, what happens if the answer is no?
What a real chart has to do
A real chart has three jobs:
Define entry criteria → what must be true before a record enters the stage
Define exit criteria → what evidence allows it to move forward
Define failure paths → nurture, recycle, disqualify, stall management, or leadership escalation
If one of those is missing, reps fill the gap themselves. Once that happens, your CRM becomes a storytelling tool instead of an operating system.
The shift in modern sales flowcharts has been away from static stage lists and toward management systems that improve handoffs and predictability in long B2B cycles, as described in Clari's view of sales process flowcharts as forecasting and governance tools. That's the right direction. A chart should govern movement, not just describe it.
The 6 core stages and their decision gates
Instead of adding more stages, teams typically need stricter gates.
The six stages below are the version we keep coming back to because they're practical in outbound-heavy B2B motions, especially when Apollo, Clay, Lemlist, Instantly, HeyReach, Sales Navigator, and HubSpot are all touching the same pipeline. The structure is simple enough to run, but hard enough to stop fake progression.
The six-stage framework
Lead in
This starts when source is captured and the account hits the system. Before anything else, run an ICP fit check.
If it fits, enrich and route it forward. If it doesn't, send it to nurture or disqualify it. No exceptions. Teams that “let reps decide later” usually just defer bad data downstream.
Contacted
Now the account enters first touch. This is multi-channel in practice, email, LinkedIn, sometimes phone, and the sequence logic should already be set by account type and persona.
The fork here is simple. Engaged goes forward. No engagement after the full sequence goes to recycle for future re-engagement. Don't leave dead air records sitting in active pipeline.
Qualified
This is the stage most teams pretend is happening while reps are really just booking meetings. Qualification needs three explicit gates: pain confirmed, budget in range, authority present.
Pass the gate and move to proposal. Fail two of the three and move back to nurture. That rule keeps sympathy pipeline from contaminating forecast pipeline.
Proposal
A proposal stage without an acknowledgment rule is where charts get sloppy. “Proposal sent” is not a milestone. It's an action.
The gate is written acknowledgment. If the buyer acknowledges scope in writing, move to negotiation. If there's silence after three follow-ups, trigger the stalled-deal playbook instead of pretending the deal is still live.
Negotiation
Objection handling and mutual close planning should happen at this stage, rather than generic chasing.
If you have verbal yes plus a start date, move to closing. If procurement or legal enters, route to a leadership review path. That branch matters because the deal has changed shape and usually timeline too.
Closed
Closed-won means signed contract and handoff to delivery. Closed-lost means loss reason logged and re-engagement timer set.
If you skip mandatory loss logging, you're throwing away the only clean feedback revenue organizations ever get from the market.
Practical rule: Each stage gets one sentence for “what qualifies entry,” one sentence for “what qualifies exit,” and one sentence for “where it goes if no.”
Why these gates matter operationally
Apollo's framework is useful here because it ties named checkpoints to benchmark conversions, including 15-25% from lead to qualified opportunity and 25-35% from proposal to closed-won in qualified pipeline, which is why stage design affects both control and forecasting, not just rep training, as shown in Apollo's guide to sales process flowcharts and checkpoint metrics.
That doesn't mean you copy Apollo's stage names blindly. It means you treat the chart like a control system. Every box needs a milestone. Every arrow implies a qualification decision. Every stage should be inspectable inside the CRM.
If you're reworking coverage and resourcing around this, especially when SDR work, admin work, and routing are split across people, this piece on optimizing sales processes through external partners has a practical angle on operational ownership.
A useful test is whether your documented flow chart of sales process matches the language in your CRM. If your reps call it “qualified,” your dashboard says “SQL,” and your playbook says “discovery complete,” you don't have stage discipline. You have three competing truths. Tighten the naming and define each deal stage once.
How to design the chart from whiteboard to CRM
Good process design starts ugly. If the first version looks polished, your team probably skipped the arguments that matter.
We use three tools in order because each solves a different problem. Miro is for thinking. Lucidchart or Whimsical is for clean documentation. HubSpot is for reality.
Start messy in Miro
Miro is where you find the missing branches.
On the first pass, don't worry about clean shapes or perfect labels. Pull sales, RevOps, and whoever owns inbound or outbound routing into the same board. Start with sticky notes and ask blunt questions.
Where does a bad-fit lead exit → not in theory, in your actual motion
What counts as engagement → open, click, reply, booked call, or something else
Who owns handoff after reply → SDR, AE, RevOps, or a shared queue
What happens when legal appears → stage move, task creation, or escalation path
This is also where multi-thread complexity shows up. Real B2B buying is not one path. Prospects can say yes, no, or ask for more time or information, and your chart has to account for those branches, which is the useful takeaway from Mural's discussion of sales process mapping for branching buyer behavior.
Don't design one buyer journey. Design the paths your champion, blocker, and signer each create in the deal.
Clean it up, then make it real in HubSpot
Once the logic settles, rebuild it in Lucidchart or Whimsical with standard shapes. Rounded shapes for start and end. Rectangles for actions. Diamonds for decisions. This version belongs in onboarding and in your playbook.
Then move to the live version. That means HubSpot pipeline stages, required properties, task automation, ownership rules, and clear stage-exit criteria inside the CRM. A flowchart that isn't mirrored in the CRM will drift within weeks.
Use required fields aggressively. If a rep cannot move “Qualified” to “Proposal” without confirming the right data, the process has a chance to hold. If stage movement is free-form, the chart is just a suggestion.
A CRM-specific implementation guide helps more than another generic diagram article here. The Glue Sky CRM strategy guide is useful for translating custom flow logic into CRM structure. If you're mapping this into a broader outbound and reporting setup, CRM integration is the layer that decides whether your chart becomes usable or stays theoretical.
A short walkthrough helps teams visualize the handoff from diagram to daily workflow:
One rule is essential. Keep the chart to one page and make it readable in 30 seconds. If a new rep can't understand the entire motion on one screen, the design is too complex, or the process is.
Visual design that drives action, not confusion
Most sales charts fail visually before they fail operationally. Every box looks the same, the exits are faint, and the decision points disappear into the page.
That's not a cosmetic issue. If reps can't see the forks instantly, they won't use the chart when they're moving fast. A sales flowchart is a decision tool, not a mural.
Use visual weight on the decisions
Color-code by function, not by stage. Keep actions in a neutral tone. Use one high-contrast color for every decision diamond.
That does two things. First, the eye can find risk points fast. Second, reps learn that the decisions are the product. The boxes are just the work around them.
Write the actual decision question inside the diamond. Don't make people cross-reference a legend. “Pain confirmed AND budget in range AND authority present?” is stronger than a diamond labeled “Qualify.”
Element | What to do | Why it works |
|---|---|---|
Action boxes | Use one neutral color | Keeps process steps readable |
Decision diamonds | Use one contrasting color | Makes forks visible in seconds |
Start and end points | Use rounded shapes | Clarifies boundaries |
High-risk gate | Add heavier border or callout | Warns reps where deals often break |
Make the exits impossible to miss
Most charts hide the disqualify and loop-back paths in thin grey arrows. That trains reps to ignore them.
Do the opposite. Make exit paths as visible as the forward path. If “not now,” “bad fit,” and “stalled” are real outcomes, they should look real on the page too.
Venngage frames modern sales flowcharts as tools for spotting bottlenecks and making processes scalable, and the useful operational point is that the chart should define where a lead goes minutes after a reply, who qualifies it, and how the feedback loop improves targeting, as outlined in its guide to sales process flowcharts as routing and SLA tools. That's why visual design matters. It changes behavior.
The easiest way to improve a chart is usually not adding detail. It's making the exits and decisions impossible to miss.
If your team already uses a documented visual language for internal assets, treat the chart the same way you'd treat any other design system. Consistency reduces interpretation errors.
How to validate your flowchart with the sales team
A flowchart designed in a workshop is still just a hypothesis. It becomes a process when you test it against real deals and field behavior.
We use three passes. Not because process people like ceremony, but because charts fail in three different ways, logic failure, field rejection, and CRM drift.
Pass 1, replay recent deals
Pull a mixed set of recent opportunities and trace them through the proposed chart. Include won and lost.
Use this review to answer practical questions:
Where did the deal branch → not where the diagram said it should
Which stage was skipped → often qualification or stalled handling
What information appeared too late → budget, authority, procurement, security, legal
Which exit path never existed on paper → nurture, recycle, escalation, or loss logging
This replay quickly exposes the difference between documented stages and lived reality. It also forces the team to define what counts as evidence for stage progression.
Pass 2 and pass 3, field reality beats conference-room logic
Pass 2 is the rep walkthrough. Sit with the people using the process and have them talk through a live deal against the chart. The useful moment is when someone says, “that's not really how this works.” That's not resistance. That's design feedback.
Pass 3 is the 30-day review after launch. Look at where deals pile up, which decision gates are skipped, and whether reps are using the defined exits. If every rep keeps creating workarounds, don't start with enforcement. Start with the assumption that the chart is wrong.
Field signal: When reps avoid an exit path entirely, it usually means the path is unrealistic, hidden, or politically unsafe to use.
Modern sales flowcharts have evolved into management frameworks that track details like deal context and decision-makers at each stage so teams can improve handoffs and predictability in longer B2B cycles. That's the useful takeaway from Clari's broader view of stage-based governance, even if your own implementation is simpler.
Quarterly review matters too. Market changes, ICP changes, and channel mix changes all break old stage logic faster than teams often admit. Treat the chart like a live ops asset, not a one-time project.
Your next step is a 10-deal audit
Don't start by redrawing your whole process.
Start with ten deals. Pull five closed-won and five closed-lost from HubSpot. Then print your current flow chart of sales process, or sketch the one your team claims to follow, and walk every deal through it step by step.
Mark the exact places where reality diverged.
Skipped gate → the rep advanced without the required evidence
Missing branch → the buyer did something your chart doesn't represent
Fake stage progression → the CRM moved forward but the deal did not
Undefined exit → the deal should have been recycled, nurtured, or disqualified earlier
That audit will tell you more than another brainstorming session. It shows where your process is fiction, where your data is getting polluted, and which stage definitions need rewriting first.
If you want a quick benchmark before doing the rebuild, run your team through this pipeline score quiz. It's a simple way to spot whether the issue is stage design, qualification discipline, or handoff control.
If your team needs help turning scattered outbound efforts, CRM stages, and reply handling into one enforceable process, Grou builds pipeline systems around clear routing, qualification rules, and shared reporting. The useful starting point is simple: audit your last ten deals, mark every undocumented branch, then rebuild the chart so HubSpot matches how deals move.

Pipeline OS Newsletter
Build qualified pipeline
Get weekly tactics to generate demand, improve lead quality, and book more meetings.
Recent posts


Trusted by industry leaders
Trusted by industry leaders
Trusted by industry leaders
Ready to build qualified pipeline?
Ready to build qualified pipeline?
Ready to build qualified pipeline?
Book a call to see if we're the right fit, or take the 2-minute quiz to get a clear starting point.
Book a call to see if we're the right fit, or take the 2-minute quiz to get a clear starting point.
Book a call to see if we're the right fit, or take the 2-minute quiz to get a clear starting point.
" height="30.21639343089746px" id="hfGbXmQR2" width="30.216393430897455px"/></svg>)
Copyright © 2026 – All Right Reserved
Company
Resources
Copyright © 2026 – All Right Reserved
Copyright © 2026 – All Right Reserved