%22%3E%3C/path%3E%3Cpath d=%22M 63.072 7.554 C 62.258 8.022 61.577 8.689 61.092 9.493 L 61.092 7.076 L 57.158 7.076 L 57.158 22.64 L 61.089 22.64 L 61.089 14.888 C 61.089 13.446 61.403 12.434 62.03 11.853 C 62.818 11.218 63.818 10.907 64.826 10.982 L 65.868 10.982 L 65.868 6.851 C 64.891 6.834 63.926 7.076 63.073 7.554 Z%22 fill=%22rgb(17,17,17)%22%3E%3C/path%3E%3Cpath d=%22M 78.916 7.82 C 76.363 6.49 73.321 6.49 70.768 7.82 C 69.562 8.473 68.564 9.451 67.888 10.644 C 67.167 11.931 66.803 13.387 66.834 14.862 C 66.804 16.332 67.157 17.785 67.86 19.077 C 68.515 20.267 69.494 21.246 70.684 21.901 C 71.924 22.576 73.318 22.92 74.73 22.898 C 76.164 22.918 77.58 22.575 78.846 21.901 C 80.062 21.247 81.073 20.27 81.768 19.077 C 82.506 17.797 82.88 16.339 82.85 14.862 C 82.88 13.389 82.517 11.934 81.797 10.647 C 81.12 9.455 80.122 8.477 78.917 7.824 M 78.803 14.862 C 78.829 15.739 78.636 16.608 78.241 17.391 C 77.903 18.046 77.38 18.588 76.738 18.95 C 76.124 19.293 75.432 19.472 74.729 19.47 C 73.668 19.497 72.648 19.061 71.934 18.276 C 71.139 17.323 70.741 16.1 70.823 14.862 C 70.741 13.62 71.149 12.395 71.959 11.45 C 72.687 10.667 73.715 10.233 74.783 10.256 C 75.859 10.236 76.894 10.67 77.635 11.45 C 78.464 12.387 78.884 13.616 78.801 14.864%22 fill=%22rgb(17,17,17)%22%3E%3C/path%3E%3Cpath d=%22M 95.906 7.076 L 95.906 15.646 C 95.975 16.68 95.643 17.701 94.979 18.498 C 94.311 19.184 93.379 19.547 92.422 19.495 C 91.475 19.544 90.553 19.18 89.894 18.498 C 89.23 17.701 88.898 16.68 88.967 15.646 L 88.967 7.076 L 85.033 7.076 L 85.033 16.207 C 85 17.449 85.275 18.68 85.834 19.79 C 86.327 20.75 87.095 21.542 88.039 22.065 C 89.033 22.594 90.145 22.861 91.271 22.838 C 92.188 22.847 93.095 22.65 93.926 22.263 C 94.708 21.905 95.388 21.36 95.906 20.675 L 95.906 22.645 L 99.865 22.645 L 99.865 7.076 Z%22 fill=%22rgb(17,17,17)%22%3E%3C/path%3E%3Cpath d=%22M 4.513 15.626 C 4.511 10.815 7.606 6.549 12.181 5.059 C 16.756 3.57 21.77 5.195 24.601 9.086 L 27.816 5.87 C 24.074 1.186 17.981 -0.943 12.137 0.393 C 6.292 1.728 1.728 6.292 0.393 12.137 C -0.943 17.981 1.186 24.074 5.87 27.816 L 9.085 24.601 C 6.214 22.512 4.515 19.177 4.513 15.626%22 fill=%22rgb(32,62,235)%22%3E%3C/path%3E%3Cpath d=%22M 17.114 14.343 L 13.354 18.01 L 13.354 18.026 L 21.071 18.026 L 11.412 27.609 L 17.389 27.609 L 23.999 21.081 L 23.999 28.316 L 24.005 28.316 L 27.967 24.393 L 27.967 14.343 Z%22 fill=%22rgb(32,62,235)%22%3E%3C/path%3E%3C/g%3E%3C/svg%3E) ×
× ××
××›
›
›
›
What to actually measure on LinkedIn 2026
What to actually measure on LinkedIn 2026
What to actually measure on LinkedIn 2026
What to actually measure on LinkedIn 2026
What to actually measure on LinkedIn 2026
What to actually measure on LinkedIn 2026

Author
Aljaz Peklaj

Almost every LinkedIn metric you can see measures whether the platform showed your content. Almost none of them measure whether it worked.
Impressions is a delivery statistic. Engagement rate is a delivery statistic divided by another delivery statistic. Even the video metric that sounds most like attention has a technical definition that would surprise most of the people reporting it. None of this is dishonest, it is just measuring the wrong end of the process, and it produces monthly reports that go up while nothing happens.
TL;DR
LinkedIn's own definitions are the fastest way to see the problem. Impressions are "the number of times people saw your ad", click-through rate is "the number of clicks divided by impressions", and average engagement is "total engagement (paid and free clicks) divided by impressions". All three describe distribution. The video metric goes further: LinkedIn defines Valid and Viewable Rate as the percentage of valid impressions viewable under the MRC standard, meaning 50% of pixels in view for at least two continuous seconds, which is a rendering threshold rather than a measure of anyone watching. Report those as operating metrics if you like, but do not treat them as outcomes. The signals worth managing to are the ones that indicate a person moved: profile views from your target accounts, connection acceptance from your ICP, replies in the inbox, and meetings that cite a post. On the paid side LinkedIn's own bottom-funnel definitions are the useful ones, conversions, conversion rate, cost per conversion, leads and cost per lead. Build the report around four or five numbers a human can act on, and stop reporting the rest.
What LinkedIn actually gives you, and what it means
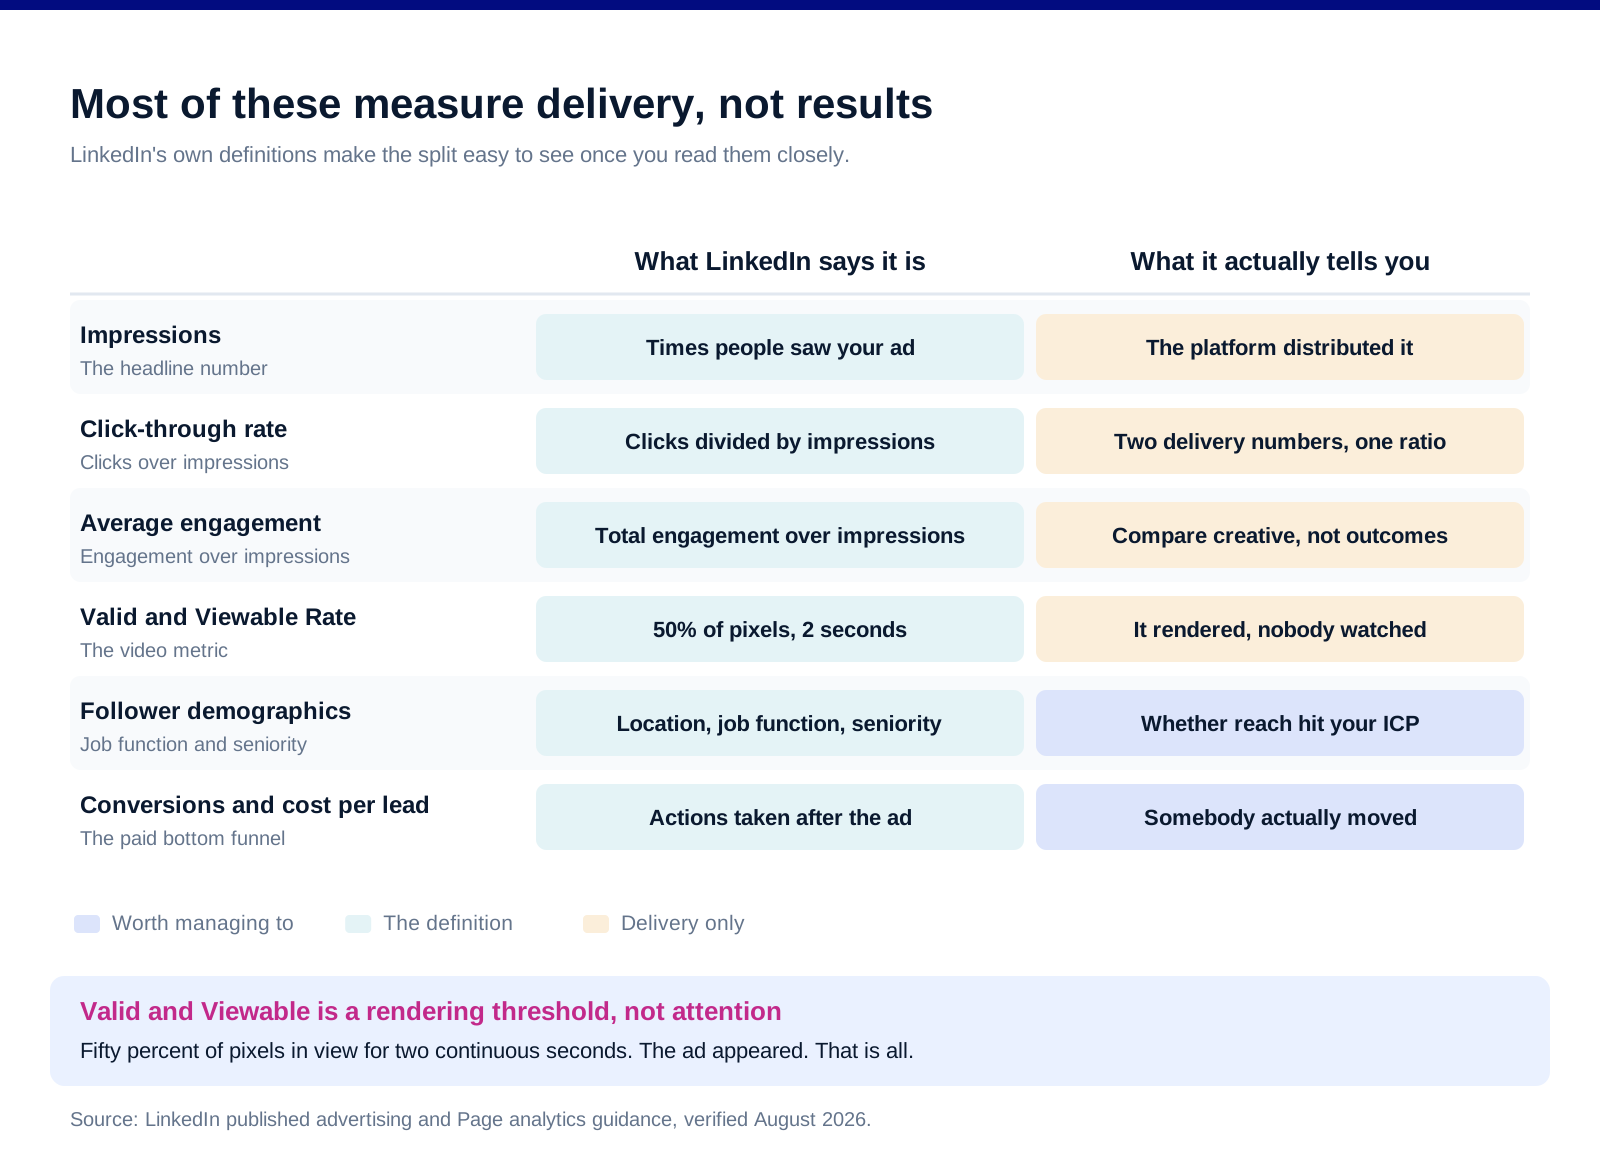
Impressions count deliveries, not readers. LinkedIn's advertising guidance defines impressions as the number of times people saw your ad. A high number means the platform distributed your content, which is information about the algorithm rather than about your audience.
Click-through rate is a ratio between two delivery numbers. Clicks divided by impressions. It moves when distribution changes, so a falling CTR frequently means you reached more marginal people rather than that your content got worse.
Average engagement has the same denominator. LinkedIn defines it as total engagement, paid and free clicks, divided by impressions. Useful for comparing creative against creative. Meaningless as a business outcome.
The video metric is the clearest example. Valid and Viewable Rate is defined as the percentage of valid impressions that were viewable under the MRC standard, which LinkedIn states as 50% of pixels in view for at least two continuous seconds. That is a technical viewability threshold. It tells you the ad rendered on screen. It does not tell you anyone watched it, and reporting it as a video engagement figure overstates what happened.
Page-level organic analytics have the same character. LinkedIn's Page analytics guidance points you at impressions, clicks, comments and social engagement percentage for the high-level view, plus follower demographics covering location, job function and seniority, and visitor analytics showing device type and aggregated professional attributes.
Demographics are the exception worth keeping. Follower and visitor breakdowns by job function and seniority answer a question that matters: whether the people you are reaching are the people you sell to. That is the one native metric that discriminates between useful reach and vanity reach.
The signals that actually predict pipeline
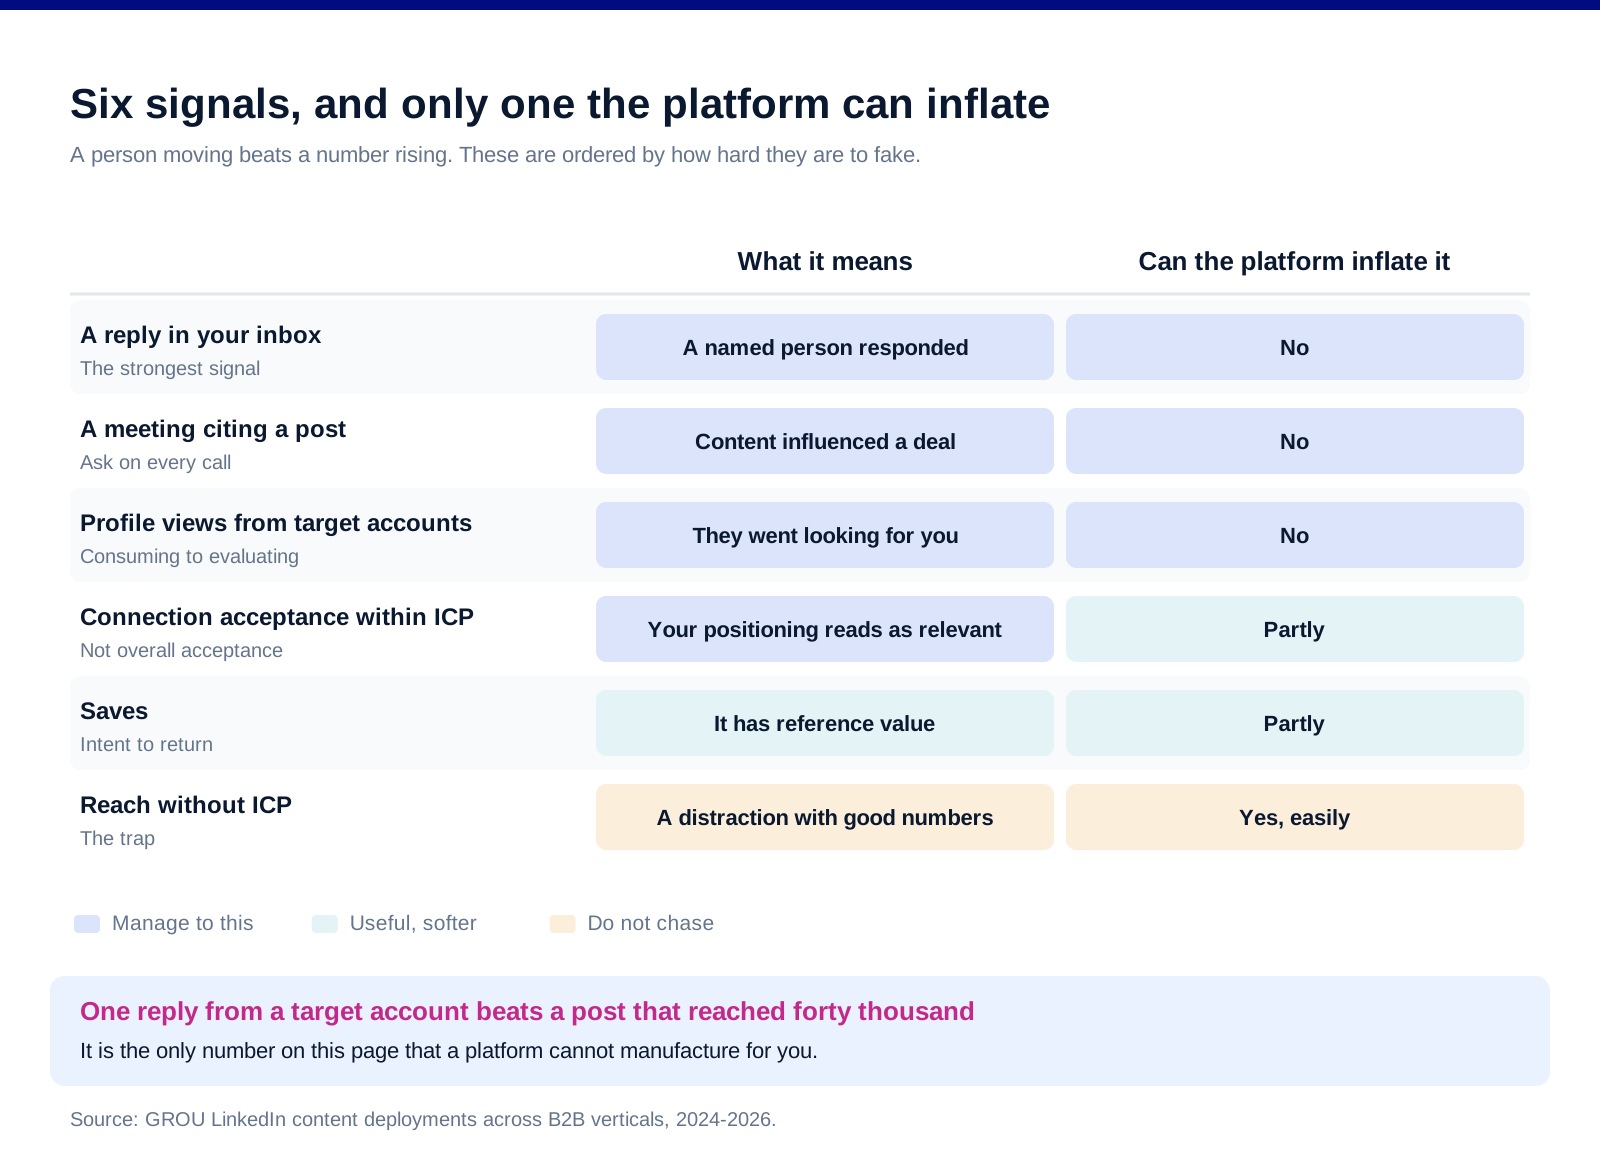
Profile views from target accounts. Someone reading your profile after seeing a post has moved from consuming to evaluating. Cross-referenced against your target list, this is the earliest genuine buying signal LinkedIn gives you.
Connection acceptance rate within your ICP. Not overall acceptance, which is dominated by people who accept everything. Acceptance among the specific titles and companies you sell to tells you whether your positioning reads as relevant to the right people.
Replies in the inbox. The only metric on this page that a platform cannot inflate. One reply from a named person in a target account is worth more than a post that reached forty thousand.
Meetings where someone mentions a post. Ask the question on every discovery call and record the answer. This is manual, unglamorous and the closest thing to attribution this channel offers, because LinkedIn content routinely influences deals it gets no credit for.
Saves, where you can see them. A save is an intent to return, which is the nearest organic proxy for reference value. Our repurposing piece covers what to do with a post that earns them.
And one negative signal worth tracking: reach without ICP. A post that travels widely among people who will never buy is a distraction with good numbers attached. If your best-performing content is consistently reaching the wrong job functions, the content is working and the targeting is not.
Build a report someone can act on
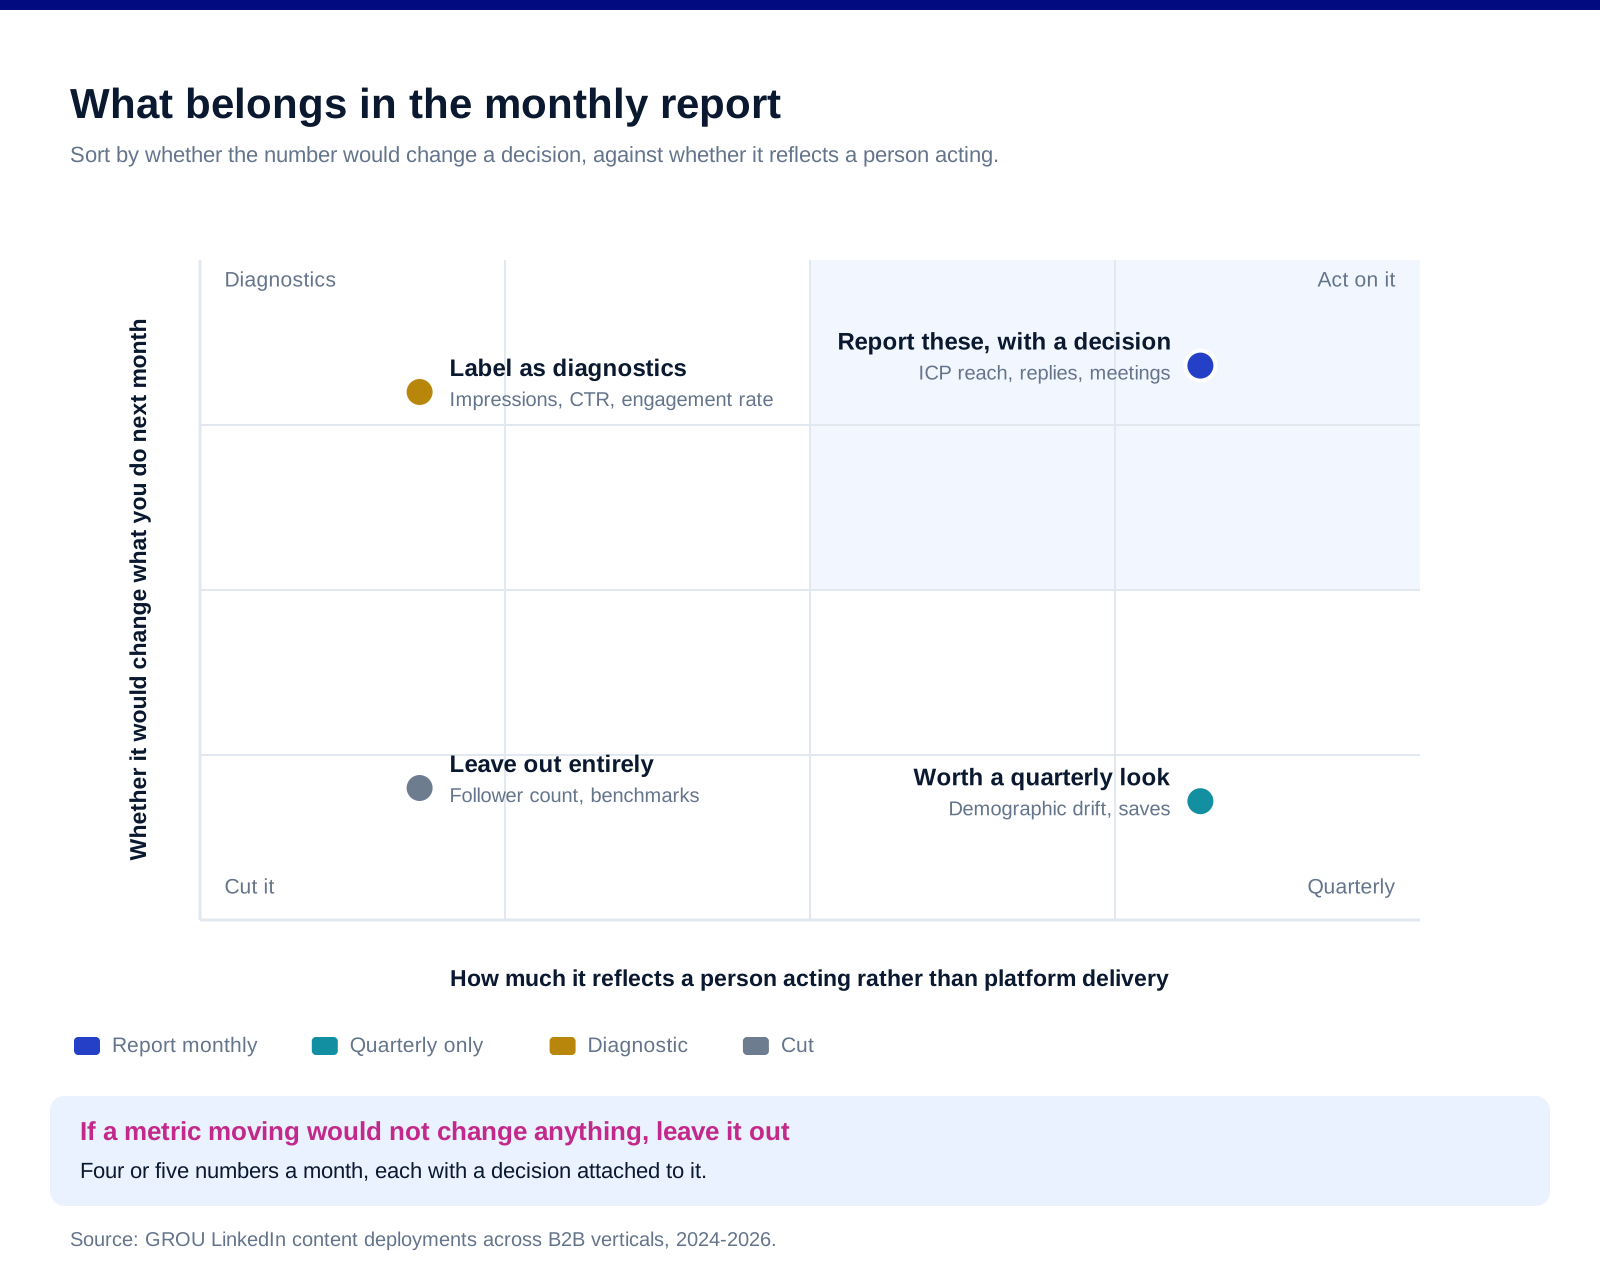
Four or five numbers, monthly, with a decision attached to each. If a metric moving would not change what you do next month, it does not belong in the report.
Lead with ICP reach rather than total reach. The share of your impressions or followers matching your target job functions and seniorities is the number that separates a working programme from a popular one.
Report replies and meetings as a count, not a rate. At the volumes most B2B companies operate at, a rate is noise. Six replies against two is a real change; 0.3% against 0.1% is the same information dressed up to look statistical.
On the paid side, use LinkedIn's own bottom-funnel definitions. Conversions, conversion rate, cost per conversion, leads and cost per lead. Those describe actions taken rather than content delivered, and they are directly comparable across channels.
Keep impressions and engagement rate, but label them. They are operating diagnostics for whether distribution changed. Putting them under a heading that says so stops them being read as results.
Review quarterly, not monthly, for anything strategic. A month is not enough signal to tell you whether a content direction is working, and reacting monthly produces a programme that changes direction faster than the audience can notice it.
What none of the dashboards will tell you
Attribution on this channel is structurally poor and always will be. People read on LinkedIn, search your company later, and arrive through organic. The post gets no credit. Accept it and ask on calls instead of building a model.
Comparing your engagement rate to a benchmark is close to meaningless. Rates depend on follower composition, posting frequency and how much of your audience is dormant. Two companies with identical content will report very different numbers.
Follower count is the least predictive number available to you. It records historical accumulation, not current relevance, and a large dormant following actively suppresses your rates.
Deleting a badly performing post does not undo anything. The impressions already happened. Leave it and learn from it.
A metric with no owner does not get acted on. If nobody is accountable for ICP reach, it will be reported and ignored like everything else.
FAQ
What LinkedIn metrics actually matter for B2B?
The ones that indicate a person moved rather than that the platform delivered content: profile views from target accounts, connection acceptance within your ICP, replies in the inbox, and meetings where someone mentions a post. On paid, LinkedIn's bottom-funnel metrics of conversions, conversion rate, cost per conversion, leads and cost per lead describe actions rather than distribution.
Are LinkedIn impressions a useful metric?
As a diagnostic, yes. As an outcome, no. LinkedIn defines impressions as the number of times people saw your ad, which tells you the platform distributed your content. Impressions rise and fall with algorithmic distribution, so the number moves for reasons unrelated to whether your content persuaded anyone. Report it as an operating statistic and label it as one.
What does Valid and Viewable Rate mean on LinkedIn?
It is the percentage of valid impressions that were viewable under the MRC standard, which LinkedIn states as 50% of pixels in view for at least two continuous seconds. That is a rendering threshold, not a measure of attention. An ad can be fully viewable by that definition while nobody watches it, so it should not be reported as a video engagement result.
How do you measure LinkedIn ROI?
Imperfectly, and honestly. Use LinkedIn's conversion metrics for anything with a tracked action, and for organic content ask on every discovery call whether the person had seen anything from you. Attribution on this channel is structurally poor because people read on LinkedIn and convert elsewhere later, so a manual question produces better information than a model will.
What is a good LinkedIn engagement rate?
The question is less useful than it looks. Engagement rate is total engagement divided by impressions, so it depends on follower composition, posting frequency and how much of your audience is dormant. Two companies posting identical content will report very different rates. Compare your own rate against your own history, and only alongside whether the reach is landing on your ICP.
How often should you review LinkedIn performance?
Monthly for a short report of four or five actionable numbers, quarterly for anything strategic. A single month contains too little signal to judge a content direction, and teams that react monthly change direction faster than their audience can register the change. The monthly review should be about execution, the quarterly one about whether the approach is working.
Bottom line
Separate the metrics that describe delivery from the ones that describe a person acting, and build the report out of the second group. LinkedIn's own definitions make the split easy to see: impressions, click-through rate and average engagement all resolve to distribution, and even Valid and Viewable Rate is a pixel threshold rather than a measure of attention. What is worth managing to is narrower and less flattering: how much of your reach lands on your ICP, how many people from target accounts looked at your profile, how many replied, and how many mentioned a post on a call. Four or five numbers, each with a decision attached. Everything else is a diagnostic, and diagnostics belong under a heading that says so.
Want the LinkedIn programme run rather than the dashboard argued about? Book a call with GROU. We run LinkedIn content and lead generation inside B2B revenue engines across verticals.
We are GROU, a B2B pipeline agency that runs lead generation, outbound, and LinkedIn content for clients across manufacturing, fintech, iGaming, software, and professional services. The measurement guidance reflects our LinkedIn content deployments between 2024 and 2026, anonymized to protect client confidentiality.
Almost every LinkedIn metric you can see measures whether the platform showed your content. Almost none of them measure whether it worked.
Impressions is a delivery statistic. Engagement rate is a delivery statistic divided by another delivery statistic. Even the video metric that sounds most like attention has a technical definition that would surprise most of the people reporting it. None of this is dishonest, it is just measuring the wrong end of the process, and it produces monthly reports that go up while nothing happens.
TL;DR
LinkedIn's own definitions are the fastest way to see the problem. Impressions are "the number of times people saw your ad", click-through rate is "the number of clicks divided by impressions", and average engagement is "total engagement (paid and free clicks) divided by impressions". All three describe distribution. The video metric goes further: LinkedIn defines Valid and Viewable Rate as the percentage of valid impressions viewable under the MRC standard, meaning 50% of pixels in view for at least two continuous seconds, which is a rendering threshold rather than a measure of anyone watching. Report those as operating metrics if you like, but do not treat them as outcomes. The signals worth managing to are the ones that indicate a person moved: profile views from your target accounts, connection acceptance from your ICP, replies in the inbox, and meetings that cite a post. On the paid side LinkedIn's own bottom-funnel definitions are the useful ones, conversions, conversion rate, cost per conversion, leads and cost per lead. Build the report around four or five numbers a human can act on, and stop reporting the rest.
What LinkedIn actually gives you, and what it means
Impressions count deliveries, not readers. LinkedIn's advertising guidance defines impressions as the number of times people saw your ad. A high number means the platform distributed your content, which is information about the algorithm rather than about your audience.
Click-through rate is a ratio between two delivery numbers. Clicks divided by impressions. It moves when distribution changes, so a falling CTR frequently means you reached more marginal people rather than that your content got worse.
Average engagement has the same denominator. LinkedIn defines it as total engagement, paid and free clicks, divided by impressions. Useful for comparing creative against creative. Meaningless as a business outcome.
The video metric is the clearest example. Valid and Viewable Rate is defined as the percentage of valid impressions that were viewable under the MRC standard, which LinkedIn states as 50% of pixels in view for at least two continuous seconds. That is a technical viewability threshold. It tells you the ad rendered on screen. It does not tell you anyone watched it, and reporting it as a video engagement figure overstates what happened.
Page-level organic analytics have the same character. LinkedIn's Page analytics guidance points you at impressions, clicks, comments and social engagement percentage for the high-level view, plus follower demographics covering location, job function and seniority, and visitor analytics showing device type and aggregated professional attributes.
Demographics are the exception worth keeping. Follower and visitor breakdowns by job function and seniority answer a question that matters: whether the people you are reaching are the people you sell to. That is the one native metric that discriminates between useful reach and vanity reach.
The signals that actually predict pipeline
Profile views from target accounts. Someone reading your profile after seeing a post has moved from consuming to evaluating. Cross-referenced against your target list, this is the earliest genuine buying signal LinkedIn gives you.
Connection acceptance rate within your ICP. Not overall acceptance, which is dominated by people who accept everything. Acceptance among the specific titles and companies you sell to tells you whether your positioning reads as relevant to the right people.
Replies in the inbox. The only metric on this page that a platform cannot inflate. One reply from a named person in a target account is worth more than a post that reached forty thousand.
Meetings where someone mentions a post. Ask the question on every discovery call and record the answer. This is manual, unglamorous and the closest thing to attribution this channel offers, because LinkedIn content routinely influences deals it gets no credit for.
Saves, where you can see them. A save is an intent to return, which is the nearest organic proxy for reference value. Our repurposing piece covers what to do with a post that earns them.
And one negative signal worth tracking: reach without ICP. A post that travels widely among people who will never buy is a distraction with good numbers attached. If your best-performing content is consistently reaching the wrong job functions, the content is working and the targeting is not.
Build a report someone can act on
Four or five numbers, monthly, with a decision attached to each. If a metric moving would not change what you do next month, it does not belong in the report.
Lead with ICP reach rather than total reach. The share of your impressions or followers matching your target job functions and seniorities is the number that separates a working programme from a popular one.
Report replies and meetings as a count, not a rate. At the volumes most B2B companies operate at, a rate is noise. Six replies against two is a real change; 0.3% against 0.1% is the same information dressed up to look statistical.
On the paid side, use LinkedIn's own bottom-funnel definitions. Conversions, conversion rate, cost per conversion, leads and cost per lead. Those describe actions taken rather than content delivered, and they are directly comparable across channels.
Keep impressions and engagement rate, but label them. They are operating diagnostics for whether distribution changed. Putting them under a heading that says so stops them being read as results.
Review quarterly, not monthly, for anything strategic. A month is not enough signal to tell you whether a content direction is working, and reacting monthly produces a programme that changes direction faster than the audience can notice it.
What none of the dashboards will tell you
Attribution on this channel is structurally poor and always will be. People read on LinkedIn, search your company later, and arrive through organic. The post gets no credit. Accept it and ask on calls instead of building a model.
Comparing your engagement rate to a benchmark is close to meaningless. Rates depend on follower composition, posting frequency and how much of your audience is dormant. Two companies with identical content will report very different numbers.
Follower count is the least predictive number available to you. It records historical accumulation, not current relevance, and a large dormant following actively suppresses your rates.
Deleting a badly performing post does not undo anything. The impressions already happened. Leave it and learn from it.
A metric with no owner does not get acted on. If nobody is accountable for ICP reach, it will be reported and ignored like everything else.
FAQ
What LinkedIn metrics actually matter for B2B?
The ones that indicate a person moved rather than that the platform delivered content: profile views from target accounts, connection acceptance within your ICP, replies in the inbox, and meetings where someone mentions a post. On paid, LinkedIn's bottom-funnel metrics of conversions, conversion rate, cost per conversion, leads and cost per lead describe actions rather than distribution.
Are LinkedIn impressions a useful metric?
As a diagnostic, yes. As an outcome, no. LinkedIn defines impressions as the number of times people saw your ad, which tells you the platform distributed your content. Impressions rise and fall with algorithmic distribution, so the number moves for reasons unrelated to whether your content persuaded anyone. Report it as an operating statistic and label it as one.
What does Valid and Viewable Rate mean on LinkedIn?
It is the percentage of valid impressions that were viewable under the MRC standard, which LinkedIn states as 50% of pixels in view for at least two continuous seconds. That is a rendering threshold, not a measure of attention. An ad can be fully viewable by that definition while nobody watches it, so it should not be reported as a video engagement result.
How do you measure LinkedIn ROI?
Imperfectly, and honestly. Use LinkedIn's conversion metrics for anything with a tracked action, and for organic content ask on every discovery call whether the person had seen anything from you. Attribution on this channel is structurally poor because people read on LinkedIn and convert elsewhere later, so a manual question produces better information than a model will.
What is a good LinkedIn engagement rate?
The question is less useful than it looks. Engagement rate is total engagement divided by impressions, so it depends on follower composition, posting frequency and how much of your audience is dormant. Two companies posting identical content will report very different rates. Compare your own rate against your own history, and only alongside whether the reach is landing on your ICP.
How often should you review LinkedIn performance?
Monthly for a short report of four or five actionable numbers, quarterly for anything strategic. A single month contains too little signal to judge a content direction, and teams that react monthly change direction faster than their audience can register the change. The monthly review should be about execution, the quarterly one about whether the approach is working.
Bottom line
Separate the metrics that describe delivery from the ones that describe a person acting, and build the report out of the second group. LinkedIn's own definitions make the split easy to see: impressions, click-through rate and average engagement all resolve to distribution, and even Valid and Viewable Rate is a pixel threshold rather than a measure of attention. What is worth managing to is narrower and less flattering: how much of your reach lands on your ICP, how many people from target accounts looked at your profile, how many replied, and how many mentioned a post on a call. Four or five numbers, each with a decision attached. Everything else is a diagnostic, and diagnostics belong under a heading that says so.
Want the LinkedIn programme run rather than the dashboard argued about? Book a call with GROU. We run LinkedIn content and lead generation inside B2B revenue engines across verticals.
We are GROU, a B2B pipeline agency that runs lead generation, outbound, and LinkedIn content for clients across manufacturing, fintech, iGaming, software, and professional services. The measurement guidance reflects our LinkedIn content deployments between 2024 and 2026, anonymized to protect client confidentiality.
Almost every LinkedIn metric you can see measures whether the platform showed your content. Almost none of them measure whether it worked.
Impressions is a delivery statistic. Engagement rate is a delivery statistic divided by another delivery statistic. Even the video metric that sounds most like attention has a technical definition that would surprise most of the people reporting it. None of this is dishonest, it is just measuring the wrong end of the process, and it produces monthly reports that go up while nothing happens.
TL;DR
LinkedIn's own definitions are the fastest way to see the problem. Impressions are "the number of times people saw your ad", click-through rate is "the number of clicks divided by impressions", and average engagement is "total engagement (paid and free clicks) divided by impressions". All three describe distribution. The video metric goes further: LinkedIn defines Valid and Viewable Rate as the percentage of valid impressions viewable under the MRC standard, meaning 50% of pixels in view for at least two continuous seconds, which is a rendering threshold rather than a measure of anyone watching. Report those as operating metrics if you like, but do not treat them as outcomes. The signals worth managing to are the ones that indicate a person moved: profile views from your target accounts, connection acceptance from your ICP, replies in the inbox, and meetings that cite a post. On the paid side LinkedIn's own bottom-funnel definitions are the useful ones, conversions, conversion rate, cost per conversion, leads and cost per lead. Build the report around four or five numbers a human can act on, and stop reporting the rest.
What LinkedIn actually gives you, and what it means
Impressions count deliveries, not readers. LinkedIn's advertising guidance defines impressions as the number of times people saw your ad. A high number means the platform distributed your content, which is information about the algorithm rather than about your audience.
Click-through rate is a ratio between two delivery numbers. Clicks divided by impressions. It moves when distribution changes, so a falling CTR frequently means you reached more marginal people rather than that your content got worse.
Average engagement has the same denominator. LinkedIn defines it as total engagement, paid and free clicks, divided by impressions. Useful for comparing creative against creative. Meaningless as a business outcome.
The video metric is the clearest example. Valid and Viewable Rate is defined as the percentage of valid impressions that were viewable under the MRC standard, which LinkedIn states as 50% of pixels in view for at least two continuous seconds. That is a technical viewability threshold. It tells you the ad rendered on screen. It does not tell you anyone watched it, and reporting it as a video engagement figure overstates what happened.
Page-level organic analytics have the same character. LinkedIn's Page analytics guidance points you at impressions, clicks, comments and social engagement percentage for the high-level view, plus follower demographics covering location, job function and seniority, and visitor analytics showing device type and aggregated professional attributes.
Demographics are the exception worth keeping. Follower and visitor breakdowns by job function and seniority answer a question that matters: whether the people you are reaching are the people you sell to. That is the one native metric that discriminates between useful reach and vanity reach.
The signals that actually predict pipeline
Profile views from target accounts. Someone reading your profile after seeing a post has moved from consuming to evaluating. Cross-referenced against your target list, this is the earliest genuine buying signal LinkedIn gives you.
Connection acceptance rate within your ICP. Not overall acceptance, which is dominated by people who accept everything. Acceptance among the specific titles and companies you sell to tells you whether your positioning reads as relevant to the right people.
Replies in the inbox. The only metric on this page that a platform cannot inflate. One reply from a named person in a target account is worth more than a post that reached forty thousand.
Meetings where someone mentions a post. Ask the question on every discovery call and record the answer. This is manual, unglamorous and the closest thing to attribution this channel offers, because LinkedIn content routinely influences deals it gets no credit for.
Saves, where you can see them. A save is an intent to return, which is the nearest organic proxy for reference value. Our repurposing piece covers what to do with a post that earns them.
And one negative signal worth tracking: reach without ICP. A post that travels widely among people who will never buy is a distraction with good numbers attached. If your best-performing content is consistently reaching the wrong job functions, the content is working and the targeting is not.
Build a report someone can act on
Four or five numbers, monthly, with a decision attached to each. If a metric moving would not change what you do next month, it does not belong in the report.
Lead with ICP reach rather than total reach. The share of your impressions or followers matching your target job functions and seniorities is the number that separates a working programme from a popular one.
Report replies and meetings as a count, not a rate. At the volumes most B2B companies operate at, a rate is noise. Six replies against two is a real change; 0.3% against 0.1% is the same information dressed up to look statistical.
On the paid side, use LinkedIn's own bottom-funnel definitions. Conversions, conversion rate, cost per conversion, leads and cost per lead. Those describe actions taken rather than content delivered, and they are directly comparable across channels.
Keep impressions and engagement rate, but label them. They are operating diagnostics for whether distribution changed. Putting them under a heading that says so stops them being read as results.
Review quarterly, not monthly, for anything strategic. A month is not enough signal to tell you whether a content direction is working, and reacting monthly produces a programme that changes direction faster than the audience can notice it.
What none of the dashboards will tell you
Attribution on this channel is structurally poor and always will be. People read on LinkedIn, search your company later, and arrive through organic. The post gets no credit. Accept it and ask on calls instead of building a model.
Comparing your engagement rate to a benchmark is close to meaningless. Rates depend on follower composition, posting frequency and how much of your audience is dormant. Two companies with identical content will report very different numbers.
Follower count is the least predictive number available to you. It records historical accumulation, not current relevance, and a large dormant following actively suppresses your rates.
Deleting a badly performing post does not undo anything. The impressions already happened. Leave it and learn from it.
A metric with no owner does not get acted on. If nobody is accountable for ICP reach, it will be reported and ignored like everything else.
FAQ
What LinkedIn metrics actually matter for B2B?
The ones that indicate a person moved rather than that the platform delivered content: profile views from target accounts, connection acceptance within your ICP, replies in the inbox, and meetings where someone mentions a post. On paid, LinkedIn's bottom-funnel metrics of conversions, conversion rate, cost per conversion, leads and cost per lead describe actions rather than distribution.
Are LinkedIn impressions a useful metric?
As a diagnostic, yes. As an outcome, no. LinkedIn defines impressions as the number of times people saw your ad, which tells you the platform distributed your content. Impressions rise and fall with algorithmic distribution, so the number moves for reasons unrelated to whether your content persuaded anyone. Report it as an operating statistic and label it as one.
What does Valid and Viewable Rate mean on LinkedIn?
It is the percentage of valid impressions that were viewable under the MRC standard, which LinkedIn states as 50% of pixels in view for at least two continuous seconds. That is a rendering threshold, not a measure of attention. An ad can be fully viewable by that definition while nobody watches it, so it should not be reported as a video engagement result.
How do you measure LinkedIn ROI?
Imperfectly, and honestly. Use LinkedIn's conversion metrics for anything with a tracked action, and for organic content ask on every discovery call whether the person had seen anything from you. Attribution on this channel is structurally poor because people read on LinkedIn and convert elsewhere later, so a manual question produces better information than a model will.
What is a good LinkedIn engagement rate?
The question is less useful than it looks. Engagement rate is total engagement divided by impressions, so it depends on follower composition, posting frequency and how much of your audience is dormant. Two companies posting identical content will report very different rates. Compare your own rate against your own history, and only alongside whether the reach is landing on your ICP.
How often should you review LinkedIn performance?
Monthly for a short report of four or five actionable numbers, quarterly for anything strategic. A single month contains too little signal to judge a content direction, and teams that react monthly change direction faster than their audience can register the change. The monthly review should be about execution, the quarterly one about whether the approach is working.
Bottom line
Separate the metrics that describe delivery from the ones that describe a person acting, and build the report out of the second group. LinkedIn's own definitions make the split easy to see: impressions, click-through rate and average engagement all resolve to distribution, and even Valid and Viewable Rate is a pixel threshold rather than a measure of attention. What is worth managing to is narrower and less flattering: how much of your reach lands on your ICP, how many people from target accounts looked at your profile, how many replied, and how many mentioned a post on a call. Four or five numbers, each with a decision attached. Everything else is a diagnostic, and diagnostics belong under a heading that says so.
Want the LinkedIn programme run rather than the dashboard argued about? Book a call with GROU. We run LinkedIn content and lead generation inside B2B revenue engines across verticals.
We are GROU, a B2B pipeline agency that runs lead generation, outbound, and LinkedIn content for clients across manufacturing, fintech, iGaming, software, and professional services. The measurement guidance reflects our LinkedIn content deployments between 2024 and 2026, anonymized to protect client confidentiality.

Pipeline OS Newsletter
Build qualified pipeline
Get weekly tactics to generate demand, improve lead quality, and book more meetings.





Trusted by industry leaders
Trusted by industry leaders
Trusted by industry leaders
Ready to build qualified pipeline?
Ready to build qualified pipeline?
Ready to build qualified pipeline?
Book a call to see if we're the right fit, or take the 2-minute quiz to get a clear starting point.
Book a call to see if we're the right fit, or take the 2-minute quiz to get a clear starting point.
Book a call to see if we're the right fit, or take the 2-minute quiz to get a clear starting point.
" height="30.21639343089746px" id="hfGbXmQR2" width="30.216393430897455px"/></svg>)
Copyright © 2026 – All Right Reserved
Copyright © 2026 – All Right Reserved
Copyright © 2026 – All Right Reserved