›
›
›
›
Lead Generation KPIs: The 3 Metrics That Drive B2B Pipeline
Lead Generation KPIs: The 3 Metrics That Drive B2B Pipeline
Lead Generation KPIs: The 3 Metrics That Drive B2B Pipeline
Lead Generation KPIs: The 3 Metrics That Drive B2B Pipeline
Lead Generation KPIs: The 3 Metrics That Drive B2B Pipeline
Lead Generation KPIs: The 3 Metrics That Drive B2B Pipeline

Author
Aljaz Peklaj

Most advice on lead generation kpis is wrong because it starts with dashboard volume, not decision quality. Teams end up tracking opens, clicks, connection rates, raw lead counts, and channel vanity, then wonder why pipeline is still unpredictable.
The fix is simpler than many marketers want it to be. Track fewer metrics, force each one to answer a business question, and review it on the right cadence. Volume still matters, but volume alone doesn't tell you whether you're creating revenue or just creating work. That baseline point shows up across lead gen benchmarking, where the useful stack separates quantity from quality through total leads, MQL share, SQL share, and source mix rather than raw counts alone, and where top channels can account for 60 to 80% of total leads, making channel-level cost and conversion analysis necessary early in the cycle, according to DataBees on lead gen metrics.
TL;DR
Track three numbers religiously → reply rate by segment, cost per qualified meeting, pipeline coverage ratio
Ignore vanity metrics → open rate, outbound click rate, LinkedIn connection rate
Use a review cadence that matches the metric → daily for deliverability, weekly for performance, monthly for strategy
Set targets with ranges, not promises → especially in a new market
Treat structure as the advantage → one message, one list, one routing system, one reporting line
Table of Contents
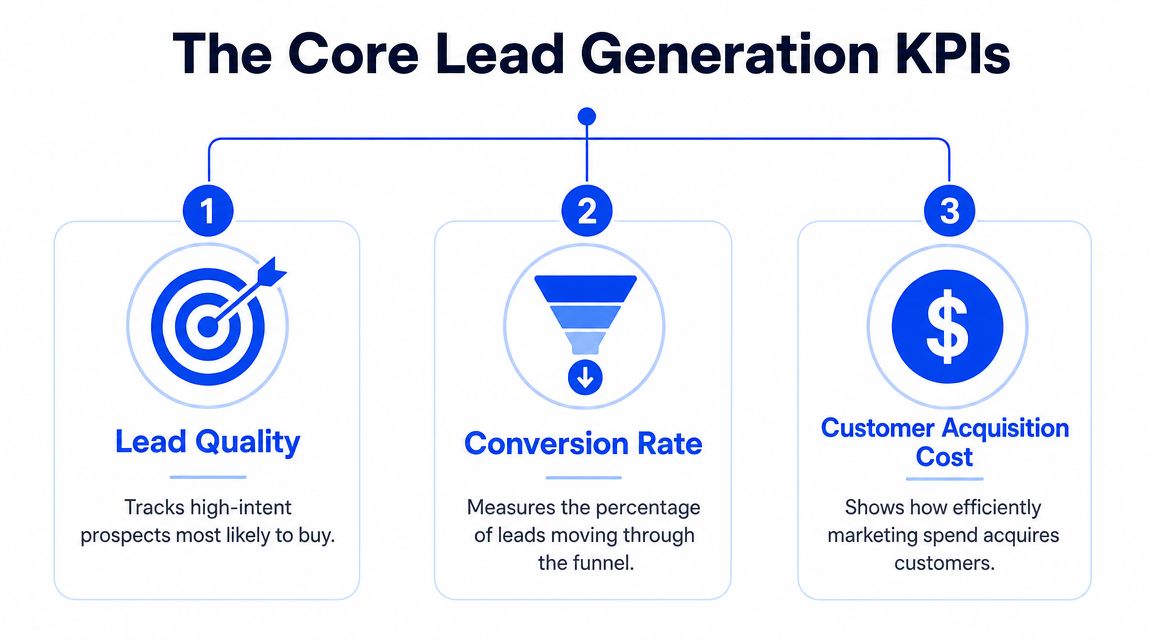
The three lead generation kpis that drive decisions
Why most dashboards fail
The three numbers that force action
What not to track, the vanity metrics to ignore
Open rate belongs in QA, not in the KPI dashboard
Click rate and connection rate create bad decisions
How to set kpi targets for any b2b campaign
A real campaign dashboard, from send to closed-won
What the numbers looked like
What the client actually used
The operational cadence for reviewing kpis and making pivots
Daily, weekly, monthly
What should trigger a pivot
Your next step, a 30-day kpi cleanup plan
Week-by-week cleanup
What your next team meeting should change
The three lead generation kpis that drive decisions
Vanity-heavy dashboards fail for a simple reason. They create discussion without creating action.
I cut most lead generation scorecards down to three numbers: reply rate by segment, cost per qualified meeting, and pipeline coverage. If a metric does not change budget, targeting, messaging, routing, or qualification standards this week, it does not belong in the top row. If you need a clean definition of what a KPI should do, Grou lays it out well in this B2B KPI glossary.
Why most dashboards fail
A 15-metric dashboard usually protects weak decisions instead of improving them. Teams can point to healthy opens, clicks, connection rates, and lead volume while pipeline stays flat.
The problem is not that those metrics are useless. The problem is that they sit too far away from revenue to guide a weekly operating call. A good lead generation dashboard should answer three questions fast. Are the right people responding? Are qualified meetings cheap enough to keep funding? Is pipeline entering the quarter at a level that gives sales a real chance to hit target?
That is the standard. Everything else is secondary.
Practical rule: If a metric cannot tell the team to scale, cut, reroute, rewrite, or tighten qualification, remove it from the executive view.
The three numbers that force action
1. Reply rate by segment
Formula: positive replies ÷ total contacts reached in that segment
Use segment-level cuts by industry, persona, geography, list source, and message angle. Blended reply rate hides the only thing that matters at this stage: where buyers are engaging.
For outbound programs, I review this daily at the segment level and weekly at the campaign level. The decision thresholds are simple. Under 3% usually means the list, offer, or message is off. 5% to 8% is healthy for many mid-market B2B outbound programs. Above 10% is strong enough to justify more volume, tighter follow-up, or a cloned segment test.
A practical example helps. If CFOs in logistics reply at 7% and operations leaders in the same account set reply at 2%, the next move is not "optimize the campaign." It is to shift budget and send volume toward the segment already showing demand.
2. Cost per qualified meeting
Formula: total campaign spend ÷ qualified meetings held
Booked meetings inflate performance. Qualified meetings keep the math honest. Count only meetings that match ICP, have a real pain point, and clear your team's minimum qualification bar.
This KPI gets reviewed every week, not once a month when the money is already spent. For active programs, a workable benchmark is $200 to $400 for SaaS and $400 to $800 for enterprise services. Above that range, the team needs to diagnose the problem fast. Weak targeting, weak offer, poor routing, or SDRs booking meetings that should never have counted.
This is also where conversion discipline matters. Teams that improve reply handling, form flow, scheduling friction, and qualification logic often lower this number faster than teams that just buy more traffic. The LinkedFuse guide on conversion rates is useful on that point because it focuses on stage-by-stage conversion instead of top-line lead volume.
3. Pipeline coverage
Formula: open pipeline value for the period ÷ revenue target for the same period
This is the forecast protection metric. If coverage is too low, clean CRM hygiene and decent close rates will not save the quarter.
Review coverage weekly with sales leadership and monthly at the executive level. For many B2B teams, 3x pipeline coverage is the minimum acceptable level and 4x is a healthier target. The exact number depends on win rate, sales cycle length, and average deal size, but the decision rule is consistent. If coverage is light, the answer is usually more qualified pipeline creation, not another meeting about rep activity.
These three KPIs work together. Reply rate by segment tells you where attention exists. Cost per qualified meeting tells you whether acquisition is efficient. Pipeline coverage tells you whether the current engine is enough to hit plan. If a number does not influence one of those decisions, it belongs below the fold, not in the operating dashboard.
What not to track, the vanity metrics to ignore
Open rate belongs in QA, not in the KPI dashboard
Teams still put open rate in the top row because it is easy to see and easy to explain. It is still the wrong metric to steer budget, headcount, or campaign changes.
Open data is noisy. Apple Mail privacy changes inflated opens. Corporate filters and security tools distort them in the other direction. A sequence can show a strong open rate and still fail on the only outcomes that matter: replies from the right segment, qualified meetings, and pipeline creation.
Use open rate for one job only. Catching deliverability issues.
If opens drop sharply across a stable segment, check domain health, inbox placement, and sending infrastructure. If opens are flat or high, that still does not mean the campaign is working. For a broader outcomes-first approach, this guide on how to measure marketing effectiveness is useful. The same logic applies when separating operating metrics from vanity metrics in B2B reporting.
Click rate and connection rate create bad decisions
Click rate is a weak KPI for outbound because many good outbound campaigns are not designed to earn clicks. They are designed to start a conversation. If the CTA is "worth a conversation?" or "should I send details?", a click-based scorecard pushes the team to optimize the wrong behavior.
LinkedIn connection rate has the same problem. It rewards low-friction tactics. Reps can loosen copy, send vague requests, and lift acceptance while reply quality stays poor. The number goes up. Revenue does not.
I have seen teams celebrate a 45% connection rate and miss pipeline targets by a mile because accepted connections never turned into qualified meetings. That is the trade-off. Surface engagement often improves when message quality gets softer. Commercial intent usually gets worse.
A cleaner operating rule works better:
Keep open rate in a deliverability view, reviewed only when inbox placement or response volume shifts
Remove click rate from outbound scorecards unless the campaign is explicitly built around a landing page conversion
Treat LinkedIn connection rate as a diagnostic, useful for profile or targeting checks, but not for budget or performance calls
If a metric does not help you decide which segment to scale, which campaign to cut, or where pipeline risk is building, it does not belong in the primary dashboard. In this model, vanity metrics stay below the fold. The top row stays limited to the three numbers that change action.
How to set kpi targets for any b2b campaign
Hard targets set too early usually create fake confidence.
A founder asks for a reply-rate target before a campaign has touched the market. The team gives a neat number. Two weeks later, the segment mix is off, replies are unqualified, and the target is already useless. The fix is simple. Set target bands for the three metrics that change decisions, then tighten those bands once the campaign produces enough signal.
I use a four-step process for this. It works for cold email, LinkedIn, or a mixed outbound motion routed through your CRM. If you are building the motion from scratch, this broader B2B lead generation campaign framework gives the channel setup around the KPI model.
Start with comparable campaigns
Use internal history first. Match on ICP, average contract value, sales cycle length, geography, and buying role. A US mid-market SaaS offer to heads of operations is not a useful benchmark for enterprise fintech outreach to CFOs. Category labels are too broad to help.
Set target bands for the three operating KPIs
Build ranges for:
Reply rate by segment
Cost per qualified meeting
Pipeline coverage
Skip single-number targets at launch. Single numbers create bad reactions to normal variance. Bands make it easier to tell the difference between a weak campaign and a campaign that just needs more volume.
Launch with a controlled sample
Send enough volume to test the message, segment, and routing path without committing the full budget. The goal is to see whether the replies are relevant, whether meetings hold, and whether sales accepts what marketing or SDRs are creating.
Lock targets after the first review window
I do not freeze campaign targets on day one. I lock them after the team has enough activity to review at the segment level. For most B2B outbound programs, that means one to two weeks of sends and at least a small set of real conversations. At that point, the team can set a working target based on observed performance instead of wishful thinking.
A simple planning table keeps this honest:
KPI | Pessimistic | Realistic | Optimistic |
|---|---|---|---|
Reply rate by segment | 3% | 6% | 9% |
Cost per qualified meeting | $450+ | $250 to $400 | Under $250 |
Pipeline coverage | Under 2x | 3x | 4x+ |
These are operating ranges, not promises.
The trade-off is straightforward. Tight targets make planning easier for leadership, but they push teams to defend assumptions that the market has not validated. Wider bands feel less precise, but they produce better decisions in the first 30 days.
Use this review cadence:
Daily: check reply quality, meeting holds, and routing issues
Weekly: review reply rate by segment and cost per qualified meeting
Every two weeks: decide what to scale, pause, or rewrite
Monthly: reset target bands based on pipeline coverage and sales feedback
If a campaign is below the reply-rate floor for a specific segment after two weekly reviews, change the list or the message. If reply rate looks healthy but cost per qualified meeting is too high, fix qualification or tighten targeting. If meetings are efficient but pipeline coverage is still below plan, the issue is volume, sales conversion, or deal size. That is why the three-metric model works. Each number points to a different action.
General benchmark articles can help with orientation, as noted earlier. They should not set your target. Your target is earned once the campaign shows how a real segment responds, what a qualified meeting costs, and whether the motion creates enough pipeline to cover revenue goals.
A real campaign dashboard, from send to closed-won
A useful dashboard does one job. It shows whether outbound is producing qualified conversations at a sane cost and enough pipeline to matter.

What the numbers looked like
Here is a 90-day B2B SaaS campaign for a mid-market manufacturing segment. The dashboard included more fields, but the decision layer came down to three metrics and the few inputs needed to explain them.
Contacts reached: 1,840
Reply rate by target segment: 8.7%, or 160 replies
Meetings booked: 47
Show rate: 84%, or 39 meetings held
Qualified meetings: 31 of 39
Cost per qualified meeting: $287
Pipeline generated: $612k across 22 active opportunities
Closed-won by day 90: 4 deals, $94k ACV combined
Pipeline coverage at day 90: 4.1x against the quarterly target
That is the full commercial story. Reply rate showed the segment and message were working. Cost per qualified meeting showed the motion was efficient enough to keep funding. Pipeline coverage showed the campaign was big enough to support the revenue plan.
Everything else was support data.
What the client actually used
The SDR manager watched reply quality and meeting holds every day. I watched the weekly segment view. The CFO cared about one line, 4.1x pipeline coverage.
That split matters because teams often stuff one dashboard with metrics for three different jobs. The result is noise. Operators need to know where to fix execution. Leadership needs to know whether the program should get more budget, keep budget, or lose budget.
In this campaign, $287 cost per qualified meeting was the control point. The average contract value was $24k, so the acquisition cost for a qualified conversation was well within range. The campaign covered its cost fast because the meetings were both relevant and sales-accepted. By day 90, the stronger proof was not booked meetings. It was 22 active opportunities and 4.1x coverage against target.
If you build this in HubSpot, Looker Studio, or a custom stack, keep two views. The executive view should show reply rate by segment, cost per qualified meeting, and pipeline coverage. The operator view can hold booked meetings, show rate, qualification rate, routing checks, and opportunity creation by source. A practical model is a set of BI reporting dashboards for revenue teams with one page for decisions and one page for diagnosis.
A short explainer on lead tracking is useful here too:
As noted earlier, broader benchmark research is useful for orientation. It should not drive the dashboard. A campaign dashboard earns trust when it shows a simple chain from replies to qualified meetings to pipeline, then holds that chain to a fixed review cadence and a budget decision.
The operational cadence for reviewing kpis and making pivots
The worst review rhythm is reacting to everything every day. The second worst is waiting until month-end and pretending the trend surprised you.

Daily, weekly, monthly
A useful cadence is simple:
Daily glance
Check deliverability only. Bounce rate, spam complaints, sender health, and routing failures. Apollo, Instantly, Lemlist, or Smartlead issues show up here first. If infrastructure is off, performance data becomes noise.
Weekly action review
Review reply rate by segment, meetings booked, show rate, and new pipeline added. Use week-over-week movement, not single-day spikes. Use these insights to cut weak personas, change message angles, or reassign spend between list segments.
Monthly strategy review
Review cost per qualified meeting, pipeline coverage, and downstream sales feedback. This is the budget conversation. It's also where tools matter differently. Clay affects list quality, HubSpot affects lifecycle cleanliness, Sales Navigator affects targeting precision, and routing logic affects lead speed.
If your team needs a label for this operating rhythm, it fits under a formal reporting cadence for RevOps. One option in this category is Grou, which combines LinkedIn, outbound, and lead routing into one reporting line so speed, fit, and message performance are reviewed together instead of in separate channel silos.
Review at the cadence of the metric. Daily decisions on weekly signals wreck otherwise good campaigns.
What should trigger a pivot
Not every bad week deserves a rebuild. Pivots should be ranked.
Immediate action
Deliverability breaks. Pause, fix, restart carefully.
Act this week
Segmented reply rate stays below the pessimistic threshold long enough to show a real pattern. Usually that means the message is wrong, the list is tired, or both.
Act this month
Cost per qualified meeting keeps rising. That often points to a qualification or discovery issue, not just a top-of-funnel problem.
Address in the next strategy cycle
Pipeline coverage drifts below the planning threshold. That's a structural capacity problem, not necessarily a same-day emergency.
Speed-to-lead deserves its own place in this system. Modern KPI frameworks often fail because they don't connect response time, connect rate, and lead quality in one view. One benchmark cited by Artisan points to a 21x drop in qualification chance when response time moves from 5 minutes to 30 minutes, which is why SLA-based routing matters most for high-intent leads, according to Artisan on lead generation KPIs.
That means inbound demos, event follow-up, and hand-raisers shouldn't sit in the same queue as low-fit list replies. Faster isn't always better for every lead. Faster is better for the right lead.
Your next step, a 30-day kpi cleanup plan
If your dashboard is crowded, don't redesign it from scratch. Strip it down and rebuild the reporting line around decisions.
Week-by-week cleanup
Week 1
Audit every metric currently shown to leadership. Mark each one with a simple test question: what decision does this KPI force? If the answer is vague, remove it from the headline dashboard.
Week 2
Create a primary scorecard with only three rows. Reply rate by segment. Cost per qualified meeting. Pipeline coverage ratio. Keep secondary diagnostics in another tab.
Week 3
Fix segmentation and attribution. If replies aren't grouped by persona, industry, and angle, your top KPI is still too blunt to use. If qualified meetings aren't clearly marked in HubSpot or your CRM, cost per qualified meeting will be unreliable.
Week 4
Set the review rhythm and lock ownership. Sales owns qualification outcomes. Marketing or outbound owns segment performance. RevOps owns reporting logic and routing integrity.
The clean dashboard isn't the one with the most data. It's the one the team can act on in the same meeting.
What your next team meeting should change
Walk into the next meeting with these three requests:
Replace blended reply rate with segmented reply rate
Replace meetings booked with qualified meetings held
Replace activity summaries with pipeline coverage against target
Then ask one operational question for each.
Where are replies strong enough to scale?
What is a qualified meeting costing us right now?
Do we have enough pipeline coverage for the next quarter?
If your team can't answer those three questions quickly, the reporting system needs work more than the campaign does.
Grou helps B2B teams turn attention into pipeline by unifying targeting, LinkedIn, outbound, routing, and reporting in one system. If your current dashboard is full of activity but thin on decisions, start with the scorecard approach above, then compare your process against how Grou structures pipeline reporting around qualified conversations and revenue.
Most advice on lead generation kpis is wrong because it starts with dashboard volume, not decision quality. Teams end up tracking opens, clicks, connection rates, raw lead counts, and channel vanity, then wonder why pipeline is still unpredictable.
The fix is simpler than many marketers want it to be. Track fewer metrics, force each one to answer a business question, and review it on the right cadence. Volume still matters, but volume alone doesn't tell you whether you're creating revenue or just creating work. That baseline point shows up across lead gen benchmarking, where the useful stack separates quantity from quality through total leads, MQL share, SQL share, and source mix rather than raw counts alone, and where top channels can account for 60 to 80% of total leads, making channel-level cost and conversion analysis necessary early in the cycle, according to DataBees on lead gen metrics.
TL;DR
Track three numbers religiously → reply rate by segment, cost per qualified meeting, pipeline coverage ratio
Ignore vanity metrics → open rate, outbound click rate, LinkedIn connection rate
Use a review cadence that matches the metric → daily for deliverability, weekly for performance, monthly for strategy
Set targets with ranges, not promises → especially in a new market
Treat structure as the advantage → one message, one list, one routing system, one reporting line
Table of Contents
The three lead generation kpis that drive decisions
Why most dashboards fail
The three numbers that force action
What not to track, the vanity metrics to ignore
Open rate belongs in QA, not in the KPI dashboard
Click rate and connection rate create bad decisions
How to set kpi targets for any b2b campaign
A real campaign dashboard, from send to closed-won
What the numbers looked like
What the client actually used
The operational cadence for reviewing kpis and making pivots
Daily, weekly, monthly
What should trigger a pivot
Your next step, a 30-day kpi cleanup plan
Week-by-week cleanup
What your next team meeting should change
The three lead generation kpis that drive decisions
Vanity-heavy dashboards fail for a simple reason. They create discussion without creating action.
I cut most lead generation scorecards down to three numbers: reply rate by segment, cost per qualified meeting, and pipeline coverage. If a metric does not change budget, targeting, messaging, routing, or qualification standards this week, it does not belong in the top row. If you need a clean definition of what a KPI should do, Grou lays it out well in this B2B KPI glossary.
Why most dashboards fail
A 15-metric dashboard usually protects weak decisions instead of improving them. Teams can point to healthy opens, clicks, connection rates, and lead volume while pipeline stays flat.
The problem is not that those metrics are useless. The problem is that they sit too far away from revenue to guide a weekly operating call. A good lead generation dashboard should answer three questions fast. Are the right people responding? Are qualified meetings cheap enough to keep funding? Is pipeline entering the quarter at a level that gives sales a real chance to hit target?
That is the standard. Everything else is secondary.
Practical rule: If a metric cannot tell the team to scale, cut, reroute, rewrite, or tighten qualification, remove it from the executive view.
The three numbers that force action
1. Reply rate by segment
Formula: positive replies ÷ total contacts reached in that segment
Use segment-level cuts by industry, persona, geography, list source, and message angle. Blended reply rate hides the only thing that matters at this stage: where buyers are engaging.
For outbound programs, I review this daily at the segment level and weekly at the campaign level. The decision thresholds are simple. Under 3% usually means the list, offer, or message is off. 5% to 8% is healthy for many mid-market B2B outbound programs. Above 10% is strong enough to justify more volume, tighter follow-up, or a cloned segment test.
A practical example helps. If CFOs in logistics reply at 7% and operations leaders in the same account set reply at 2%, the next move is not "optimize the campaign." It is to shift budget and send volume toward the segment already showing demand.
2. Cost per qualified meeting
Formula: total campaign spend ÷ qualified meetings held
Booked meetings inflate performance. Qualified meetings keep the math honest. Count only meetings that match ICP, have a real pain point, and clear your team's minimum qualification bar.
This KPI gets reviewed every week, not once a month when the money is already spent. For active programs, a workable benchmark is $200 to $400 for SaaS and $400 to $800 for enterprise services. Above that range, the team needs to diagnose the problem fast. Weak targeting, weak offer, poor routing, or SDRs booking meetings that should never have counted.
This is also where conversion discipline matters. Teams that improve reply handling, form flow, scheduling friction, and qualification logic often lower this number faster than teams that just buy more traffic. The LinkedFuse guide on conversion rates is useful on that point because it focuses on stage-by-stage conversion instead of top-line lead volume.
3. Pipeline coverage
Formula: open pipeline value for the period ÷ revenue target for the same period
This is the forecast protection metric. If coverage is too low, clean CRM hygiene and decent close rates will not save the quarter.
Review coverage weekly with sales leadership and monthly at the executive level. For many B2B teams, 3x pipeline coverage is the minimum acceptable level and 4x is a healthier target. The exact number depends on win rate, sales cycle length, and average deal size, but the decision rule is consistent. If coverage is light, the answer is usually more qualified pipeline creation, not another meeting about rep activity.
These three KPIs work together. Reply rate by segment tells you where attention exists. Cost per qualified meeting tells you whether acquisition is efficient. Pipeline coverage tells you whether the current engine is enough to hit plan. If a number does not influence one of those decisions, it belongs below the fold, not in the operating dashboard.
What not to track, the vanity metrics to ignore
Open rate belongs in QA, not in the KPI dashboard
Teams still put open rate in the top row because it is easy to see and easy to explain. It is still the wrong metric to steer budget, headcount, or campaign changes.
Open data is noisy. Apple Mail privacy changes inflated opens. Corporate filters and security tools distort them in the other direction. A sequence can show a strong open rate and still fail on the only outcomes that matter: replies from the right segment, qualified meetings, and pipeline creation.
Use open rate for one job only. Catching deliverability issues.
If opens drop sharply across a stable segment, check domain health, inbox placement, and sending infrastructure. If opens are flat or high, that still does not mean the campaign is working. For a broader outcomes-first approach, this guide on how to measure marketing effectiveness is useful. The same logic applies when separating operating metrics from vanity metrics in B2B reporting.
Click rate and connection rate create bad decisions
Click rate is a weak KPI for outbound because many good outbound campaigns are not designed to earn clicks. They are designed to start a conversation. If the CTA is "worth a conversation?" or "should I send details?", a click-based scorecard pushes the team to optimize the wrong behavior.
LinkedIn connection rate has the same problem. It rewards low-friction tactics. Reps can loosen copy, send vague requests, and lift acceptance while reply quality stays poor. The number goes up. Revenue does not.
I have seen teams celebrate a 45% connection rate and miss pipeline targets by a mile because accepted connections never turned into qualified meetings. That is the trade-off. Surface engagement often improves when message quality gets softer. Commercial intent usually gets worse.
A cleaner operating rule works better:
Keep open rate in a deliverability view, reviewed only when inbox placement or response volume shifts
Remove click rate from outbound scorecards unless the campaign is explicitly built around a landing page conversion
Treat LinkedIn connection rate as a diagnostic, useful for profile or targeting checks, but not for budget or performance calls
If a metric does not help you decide which segment to scale, which campaign to cut, or where pipeline risk is building, it does not belong in the primary dashboard. In this model, vanity metrics stay below the fold. The top row stays limited to the three numbers that change action.
How to set kpi targets for any b2b campaign
Hard targets set too early usually create fake confidence.
A founder asks for a reply-rate target before a campaign has touched the market. The team gives a neat number. Two weeks later, the segment mix is off, replies are unqualified, and the target is already useless. The fix is simple. Set target bands for the three metrics that change decisions, then tighten those bands once the campaign produces enough signal.
I use a four-step process for this. It works for cold email, LinkedIn, or a mixed outbound motion routed through your CRM. If you are building the motion from scratch, this broader B2B lead generation campaign framework gives the channel setup around the KPI model.
Start with comparable campaigns
Use internal history first. Match on ICP, average contract value, sales cycle length, geography, and buying role. A US mid-market SaaS offer to heads of operations is not a useful benchmark for enterprise fintech outreach to CFOs. Category labels are too broad to help.
Set target bands for the three operating KPIs
Build ranges for:
Reply rate by segment
Cost per qualified meeting
Pipeline coverage
Skip single-number targets at launch. Single numbers create bad reactions to normal variance. Bands make it easier to tell the difference between a weak campaign and a campaign that just needs more volume.
Launch with a controlled sample
Send enough volume to test the message, segment, and routing path without committing the full budget. The goal is to see whether the replies are relevant, whether meetings hold, and whether sales accepts what marketing or SDRs are creating.
Lock targets after the first review window
I do not freeze campaign targets on day one. I lock them after the team has enough activity to review at the segment level. For most B2B outbound programs, that means one to two weeks of sends and at least a small set of real conversations. At that point, the team can set a working target based on observed performance instead of wishful thinking.
A simple planning table keeps this honest:
KPI | Pessimistic | Realistic | Optimistic |
|---|---|---|---|
Reply rate by segment | 3% | 6% | 9% |
Cost per qualified meeting | $450+ | $250 to $400 | Under $250 |
Pipeline coverage | Under 2x | 3x | 4x+ |
These are operating ranges, not promises.
The trade-off is straightforward. Tight targets make planning easier for leadership, but they push teams to defend assumptions that the market has not validated. Wider bands feel less precise, but they produce better decisions in the first 30 days.
Use this review cadence:
Daily: check reply quality, meeting holds, and routing issues
Weekly: review reply rate by segment and cost per qualified meeting
Every two weeks: decide what to scale, pause, or rewrite
Monthly: reset target bands based on pipeline coverage and sales feedback
If a campaign is below the reply-rate floor for a specific segment after two weekly reviews, change the list or the message. If reply rate looks healthy but cost per qualified meeting is too high, fix qualification or tighten targeting. If meetings are efficient but pipeline coverage is still below plan, the issue is volume, sales conversion, or deal size. That is why the three-metric model works. Each number points to a different action.
General benchmark articles can help with orientation, as noted earlier. They should not set your target. Your target is earned once the campaign shows how a real segment responds, what a qualified meeting costs, and whether the motion creates enough pipeline to cover revenue goals.
A real campaign dashboard, from send to closed-won
A useful dashboard does one job. It shows whether outbound is producing qualified conversations at a sane cost and enough pipeline to matter.
What the numbers looked like
Here is a 90-day B2B SaaS campaign for a mid-market manufacturing segment. The dashboard included more fields, but the decision layer came down to three metrics and the few inputs needed to explain them.
Contacts reached: 1,840
Reply rate by target segment: 8.7%, or 160 replies
Meetings booked: 47
Show rate: 84%, or 39 meetings held
Qualified meetings: 31 of 39
Cost per qualified meeting: $287
Pipeline generated: $612k across 22 active opportunities
Closed-won by day 90: 4 deals, $94k ACV combined
Pipeline coverage at day 90: 4.1x against the quarterly target
That is the full commercial story. Reply rate showed the segment and message were working. Cost per qualified meeting showed the motion was efficient enough to keep funding. Pipeline coverage showed the campaign was big enough to support the revenue plan.
Everything else was support data.
What the client actually used
The SDR manager watched reply quality and meeting holds every day. I watched the weekly segment view. The CFO cared about one line, 4.1x pipeline coverage.
That split matters because teams often stuff one dashboard with metrics for three different jobs. The result is noise. Operators need to know where to fix execution. Leadership needs to know whether the program should get more budget, keep budget, or lose budget.
In this campaign, $287 cost per qualified meeting was the control point. The average contract value was $24k, so the acquisition cost for a qualified conversation was well within range. The campaign covered its cost fast because the meetings were both relevant and sales-accepted. By day 90, the stronger proof was not booked meetings. It was 22 active opportunities and 4.1x coverage against target.
If you build this in HubSpot, Looker Studio, or a custom stack, keep two views. The executive view should show reply rate by segment, cost per qualified meeting, and pipeline coverage. The operator view can hold booked meetings, show rate, qualification rate, routing checks, and opportunity creation by source. A practical model is a set of BI reporting dashboards for revenue teams with one page for decisions and one page for diagnosis.
A short explainer on lead tracking is useful here too:
As noted earlier, broader benchmark research is useful for orientation. It should not drive the dashboard. A campaign dashboard earns trust when it shows a simple chain from replies to qualified meetings to pipeline, then holds that chain to a fixed review cadence and a budget decision.
The operational cadence for reviewing kpis and making pivots
The worst review rhythm is reacting to everything every day. The second worst is waiting until month-end and pretending the trend surprised you.
Daily, weekly, monthly
A useful cadence is simple:
Daily glance
Check deliverability only. Bounce rate, spam complaints, sender health, and routing failures. Apollo, Instantly, Lemlist, or Smartlead issues show up here first. If infrastructure is off, performance data becomes noise.
Weekly action review
Review reply rate by segment, meetings booked, show rate, and new pipeline added. Use week-over-week movement, not single-day spikes. Use these insights to cut weak personas, change message angles, or reassign spend between list segments.
Monthly strategy review
Review cost per qualified meeting, pipeline coverage, and downstream sales feedback. This is the budget conversation. It's also where tools matter differently. Clay affects list quality, HubSpot affects lifecycle cleanliness, Sales Navigator affects targeting precision, and routing logic affects lead speed.
If your team needs a label for this operating rhythm, it fits under a formal reporting cadence for RevOps. One option in this category is Grou, which combines LinkedIn, outbound, and lead routing into one reporting line so speed, fit, and message performance are reviewed together instead of in separate channel silos.
Review at the cadence of the metric. Daily decisions on weekly signals wreck otherwise good campaigns.
What should trigger a pivot
Not every bad week deserves a rebuild. Pivots should be ranked.
Immediate action
Deliverability breaks. Pause, fix, restart carefully.
Act this week
Segmented reply rate stays below the pessimistic threshold long enough to show a real pattern. Usually that means the message is wrong, the list is tired, or both.
Act this month
Cost per qualified meeting keeps rising. That often points to a qualification or discovery issue, not just a top-of-funnel problem.
Address in the next strategy cycle
Pipeline coverage drifts below the planning threshold. That's a structural capacity problem, not necessarily a same-day emergency.
Speed-to-lead deserves its own place in this system. Modern KPI frameworks often fail because they don't connect response time, connect rate, and lead quality in one view. One benchmark cited by Artisan points to a 21x drop in qualification chance when response time moves from 5 minutes to 30 minutes, which is why SLA-based routing matters most for high-intent leads, according to Artisan on lead generation KPIs.
That means inbound demos, event follow-up, and hand-raisers shouldn't sit in the same queue as low-fit list replies. Faster isn't always better for every lead. Faster is better for the right lead.
Your next step, a 30-day kpi cleanup plan
If your dashboard is crowded, don't redesign it from scratch. Strip it down and rebuild the reporting line around decisions.
Week-by-week cleanup
Week 1
Audit every metric currently shown to leadership. Mark each one with a simple test question: what decision does this KPI force? If the answer is vague, remove it from the headline dashboard.
Week 2
Create a primary scorecard with only three rows. Reply rate by segment. Cost per qualified meeting. Pipeline coverage ratio. Keep secondary diagnostics in another tab.
Week 3
Fix segmentation and attribution. If replies aren't grouped by persona, industry, and angle, your top KPI is still too blunt to use. If qualified meetings aren't clearly marked in HubSpot or your CRM, cost per qualified meeting will be unreliable.
Week 4
Set the review rhythm and lock ownership. Sales owns qualification outcomes. Marketing or outbound owns segment performance. RevOps owns reporting logic and routing integrity.
The clean dashboard isn't the one with the most data. It's the one the team can act on in the same meeting.
What your next team meeting should change
Walk into the next meeting with these three requests:
Replace blended reply rate with segmented reply rate
Replace meetings booked with qualified meetings held
Replace activity summaries with pipeline coverage against target
Then ask one operational question for each.
Where are replies strong enough to scale?
What is a qualified meeting costing us right now?
Do we have enough pipeline coverage for the next quarter?
If your team can't answer those three questions quickly, the reporting system needs work more than the campaign does.
Grou helps B2B teams turn attention into pipeline by unifying targeting, LinkedIn, outbound, routing, and reporting in one system. If your current dashboard is full of activity but thin on decisions, start with the scorecard approach above, then compare your process against how Grou structures pipeline reporting around qualified conversations and revenue.

Pipeline OS Newsletter
Build qualified pipeline
Get weekly tactics to generate demand, improve lead quality, and book more meetings.
Recent posts


Trusted by industry leaders
Trusted by industry leaders
Trusted by industry leaders
Ready to build qualified pipeline?
Ready to build qualified pipeline?
Ready to build qualified pipeline?
Book a call to see if we're the right fit, or take the 2-minute quiz to get a clear starting point.
Book a call to see if we're the right fit, or take the 2-minute quiz to get a clear starting point.
Book a call to see if we're the right fit, or take the 2-minute quiz to get a clear starting point.
" height="30.21639343089746px" id="hfGbXmQR2" width="30.216393430897455px"/></svg>)
Copyright © 2026 – All Right Reserved
Company
Resources
Copyright © 2026 – All Right Reserved
Copyright © 2026 – All Right Reserved