%22%3E%3C/path%3E%3Cpath d=%22M 63.072 7.554 C 62.258 8.022 61.577 8.689 61.092 9.493 L 61.092 7.076 L 57.158 7.076 L 57.158 22.64 L 61.089 22.64 L 61.089 14.888 C 61.089 13.446 61.403 12.434 62.03 11.853 C 62.818 11.218 63.818 10.907 64.826 10.982 L 65.868 10.982 L 65.868 6.851 C 64.891 6.834 63.926 7.076 63.073 7.554 Z%22 fill=%22rgb(17,17,17)%22%3E%3C/path%3E%3Cpath d=%22M 78.916 7.82 C 76.363 6.49 73.321 6.49 70.768 7.82 C 69.562 8.473 68.564 9.451 67.888 10.644 C 67.167 11.931 66.803 13.387 66.834 14.862 C 66.804 16.332 67.157 17.785 67.86 19.077 C 68.515 20.267 69.494 21.246 70.684 21.901 C 71.924 22.576 73.318 22.92 74.73 22.898 C 76.164 22.918 77.58 22.575 78.846 21.901 C 80.062 21.247 81.073 20.27 81.768 19.077 C 82.506 17.797 82.88 16.339 82.85 14.862 C 82.88 13.389 82.517 11.934 81.797 10.647 C 81.12 9.455 80.122 8.477 78.917 7.824 M 78.803 14.862 C 78.829 15.739 78.636 16.608 78.241 17.391 C 77.903 18.046 77.38 18.588 76.738 18.95 C 76.124 19.293 75.432 19.472 74.729 19.47 C 73.668 19.497 72.648 19.061 71.934 18.276 C 71.139 17.323 70.741 16.1 70.823 14.862 C 70.741 13.62 71.149 12.395 71.959 11.45 C 72.687 10.667 73.715 10.233 74.783 10.256 C 75.859 10.236 76.894 10.67 77.635 11.45 C 78.464 12.387 78.884 13.616 78.801 14.864%22 fill=%22rgb(17,17,17)%22%3E%3C/path%3E%3Cpath d=%22M 95.906 7.076 L 95.906 15.646 C 95.975 16.68 95.643 17.701 94.979 18.498 C 94.311 19.184 93.379 19.547 92.422 19.495 C 91.475 19.544 90.553 19.18 89.894 18.498 C 89.23 17.701 88.898 16.68 88.967 15.646 L 88.967 7.076 L 85.033 7.076 L 85.033 16.207 C 85 17.449 85.275 18.68 85.834 19.79 C 86.327 20.75 87.095 21.542 88.039 22.065 C 89.033 22.594 90.145 22.861 91.271 22.838 C 92.188 22.847 93.095 22.65 93.926 22.263 C 94.708 21.905 95.388 21.36 95.906 20.675 L 95.906 22.645 L 99.865 22.645 L 99.865 7.076 Z%22 fill=%22rgb(17,17,17)%22%3E%3C/path%3E%3Cpath d=%22M 4.513 15.626 C 4.511 10.815 7.606 6.549 12.181 5.059 C 16.756 3.57 21.77 5.195 24.601 9.086 L 27.816 5.87 C 24.074 1.186 17.981 -0.943 12.137 0.393 C 6.292 1.728 1.728 6.292 0.393 12.137 C -0.943 17.981 1.186 24.074 5.87 27.816 L 9.085 24.601 C 6.214 22.512 4.515 19.177 4.513 15.626%22 fill=%22rgb(32,62,235)%22%3E%3C/path%3E%3Cpath d=%22M 17.114 14.343 L 13.354 18.01 L 13.354 18.026 L 21.071 18.026 L 11.412 27.609 L 17.389 27.609 L 23.999 21.081 L 23.999 28.316 L 24.005 28.316 L 27.967 24.393 L 27.967 14.343 Z%22 fill=%22rgb(32,62,235)%22%3E%3C/path%3E%3C/g%3E%3C/svg%3E) ×
× ××
××

When outbound goes quiet, the sequence gets rewritten. Two of the three most common causes are not in the sequence at all, and both are checkable in an afternoon.
The third cause is the one nobody wants to hear, which is that nothing broke and you are reading noise. That one has a test too, and running it before the rewrite has saved more working campaigns than any copy change we have made.
TL;DR
Diagnose in this order, because the cheap checks rule out the expensive rewrite. First, delivery: read your bounce codes by class rather than as one number, since RFC 3463 makes a 5.x.x a permanent failure "not likely to be resolved by resending the message in the current form" and a 4.x.x a persistent transient one, and watch your spam rate against Google's 0.30 percent limit. Second, data: US Bureau of Labor Statistics figures for June 2026 put the monthly quits rate at 2.0 percent and total separations at 3.4 percent, which compounds to roughly a third of a list having left their employer within a year and over half within two. Third, measurement: a fall from 2.4 to 1.6 percent on 500 sends produces Wilson 95 percent intervals of 1.4 to 4.2 and 0.8 to 3.1 percent, which overlap almost entirely, so on that volume you have not observed a decline at all. Only when all three come back clean is the message the thing to change.
Signature one: it is not being delivered
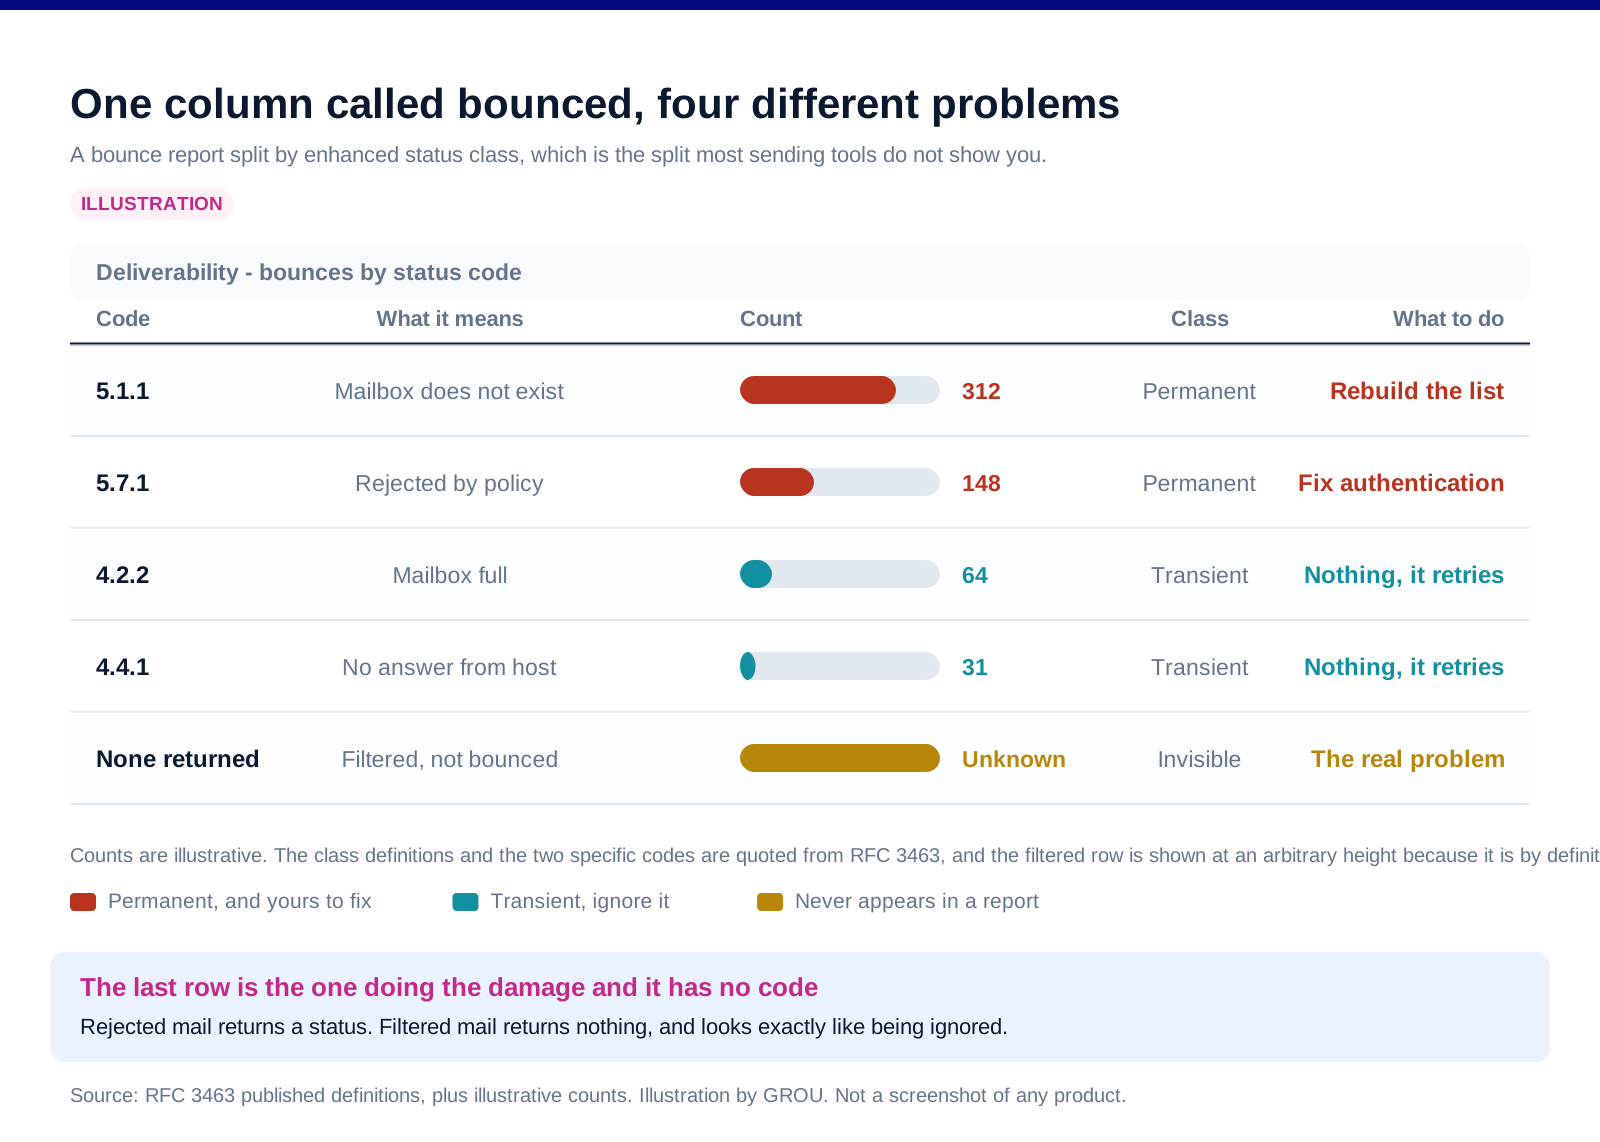
A bounce is information and silence is not. Rejected mail comes back with a code. Filtered mail does not come back at all, it simply never arrives, and in your sending tool it looks identical to a message that landed and was ignored. That is why a delivery problem so often presents as a copy problem.
So read the bounce classes separately. RFC 3463 defines a class 5 status as "a permanent failure", one "not likely to be resolved by resending the message in the current form", and a class 4 as "a persistent transient failure", where the message is valid but a temporary condition delayed it. A 5.1.1 means "the mailbox specified in the address does not exist". A 4.2.2 means the mailbox is full. Those are a data problem and a nothing, and most tools report both as "bounced".
Then look at the rate you are actually judged on. Google's sender guidelines require all senders to keep spam rates reported in Postmaster Tools below 0.3 percent, and recommend staying below 0.10 percent while avoiding 0.30 percent or higher. A campaign that crossed that line last month explains a quiet inbox this month far better than a weaker subject line does.
The tell to look for. Replies fall and opens fall roughly in step, while hard bounces creep upward. That pattern is upstream of the message. If replies fall while opens hold, the message is a live suspect again.
And check whether anything changed on your side. New sending domain, new tool, a mailbox added, a DNS record edited by someone tidying up. Delivery breaks on changes, and the change is usually two weeks before the symptom. Our email deliverability guide covers the setup that this is testing.
Signature two: the list decayed underneath you
Contact lists rot at a rate you can look up. The US Bureau of Labor Statistics reported a quits rate of 2.0 percent and a total separations rate of 3.4 percent for June 2026, defining quits as "generally voluntary separations initiated by the employee" and total separations as including "quits, layoffs and discharges, and other separations".
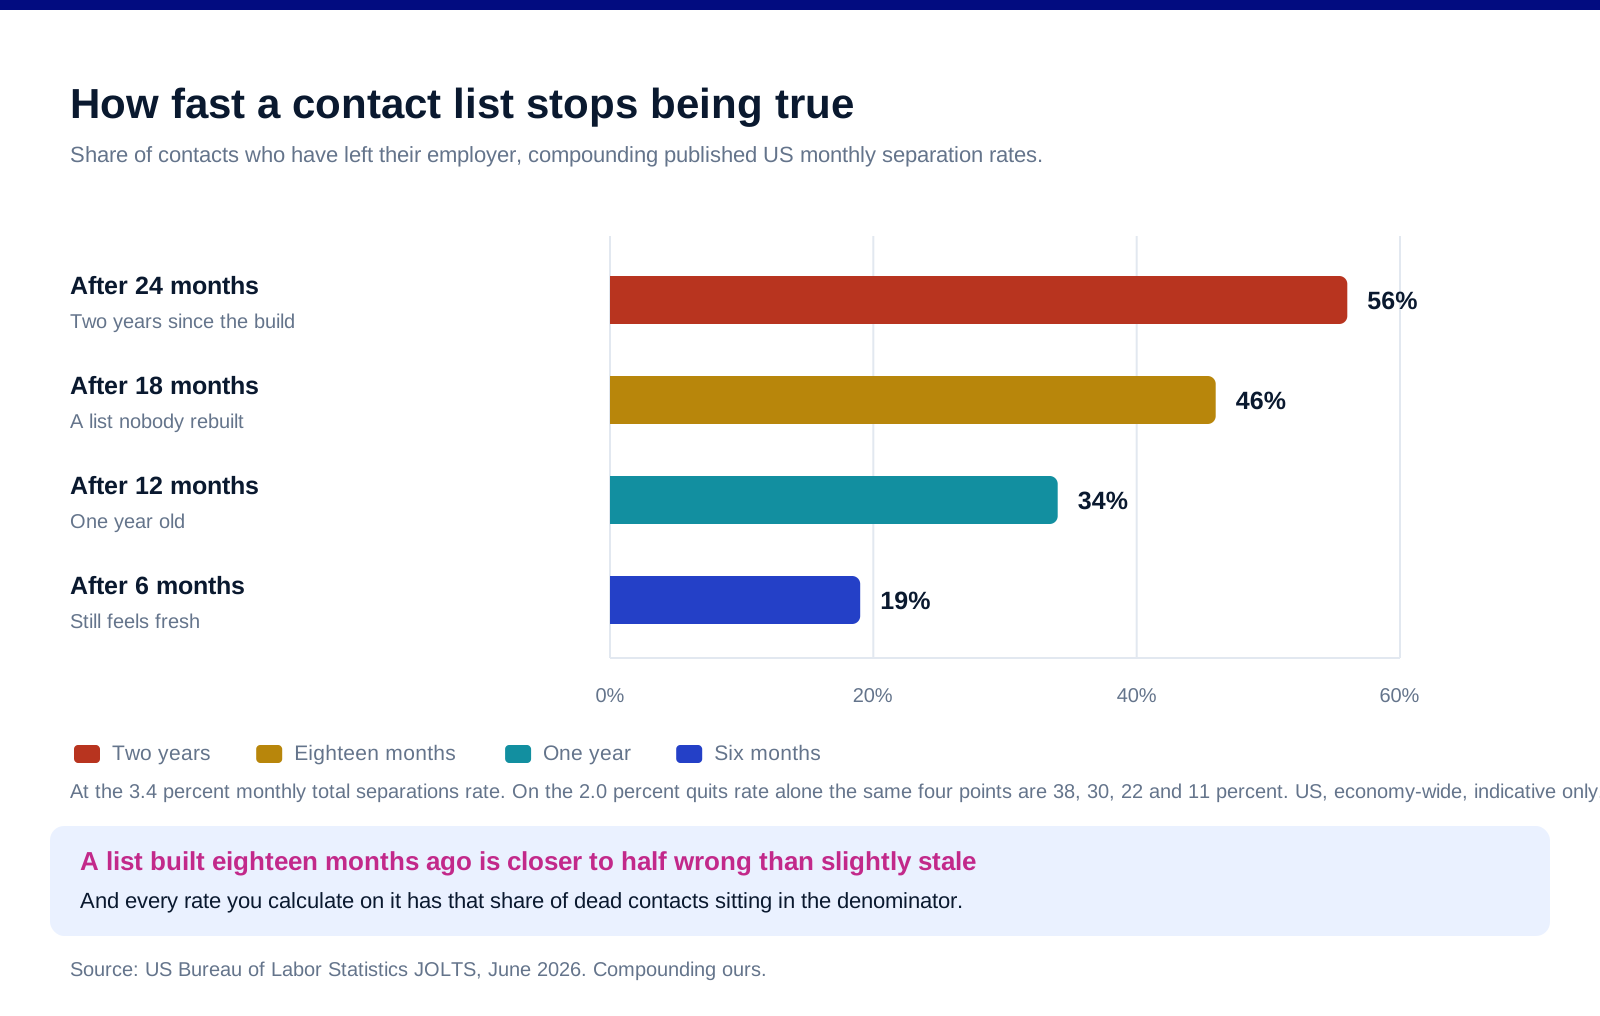
Compound that and the numbers get uncomfortable. At 3.4 percent a month, roughly 19 percent of a list has left its employer after six months, about 34 percent after a year, and about 56 percent after two. On the quits rate alone it is about 11 percent, 22 percent and 38 percent. A list built eighteen months ago and never refreshed is closer to half wrong than to slightly stale.
Treat those as indicative rather than exact. They are US figures, they are economy-wide rather than specific to the roles you sell to, and compounding a monthly rate assumes a uniformity that real populations do not have. Senior roles in stable industries move slower, and early-career roles in fast-growing sectors move much faster. The point is the order of magnitude, not the decimal.
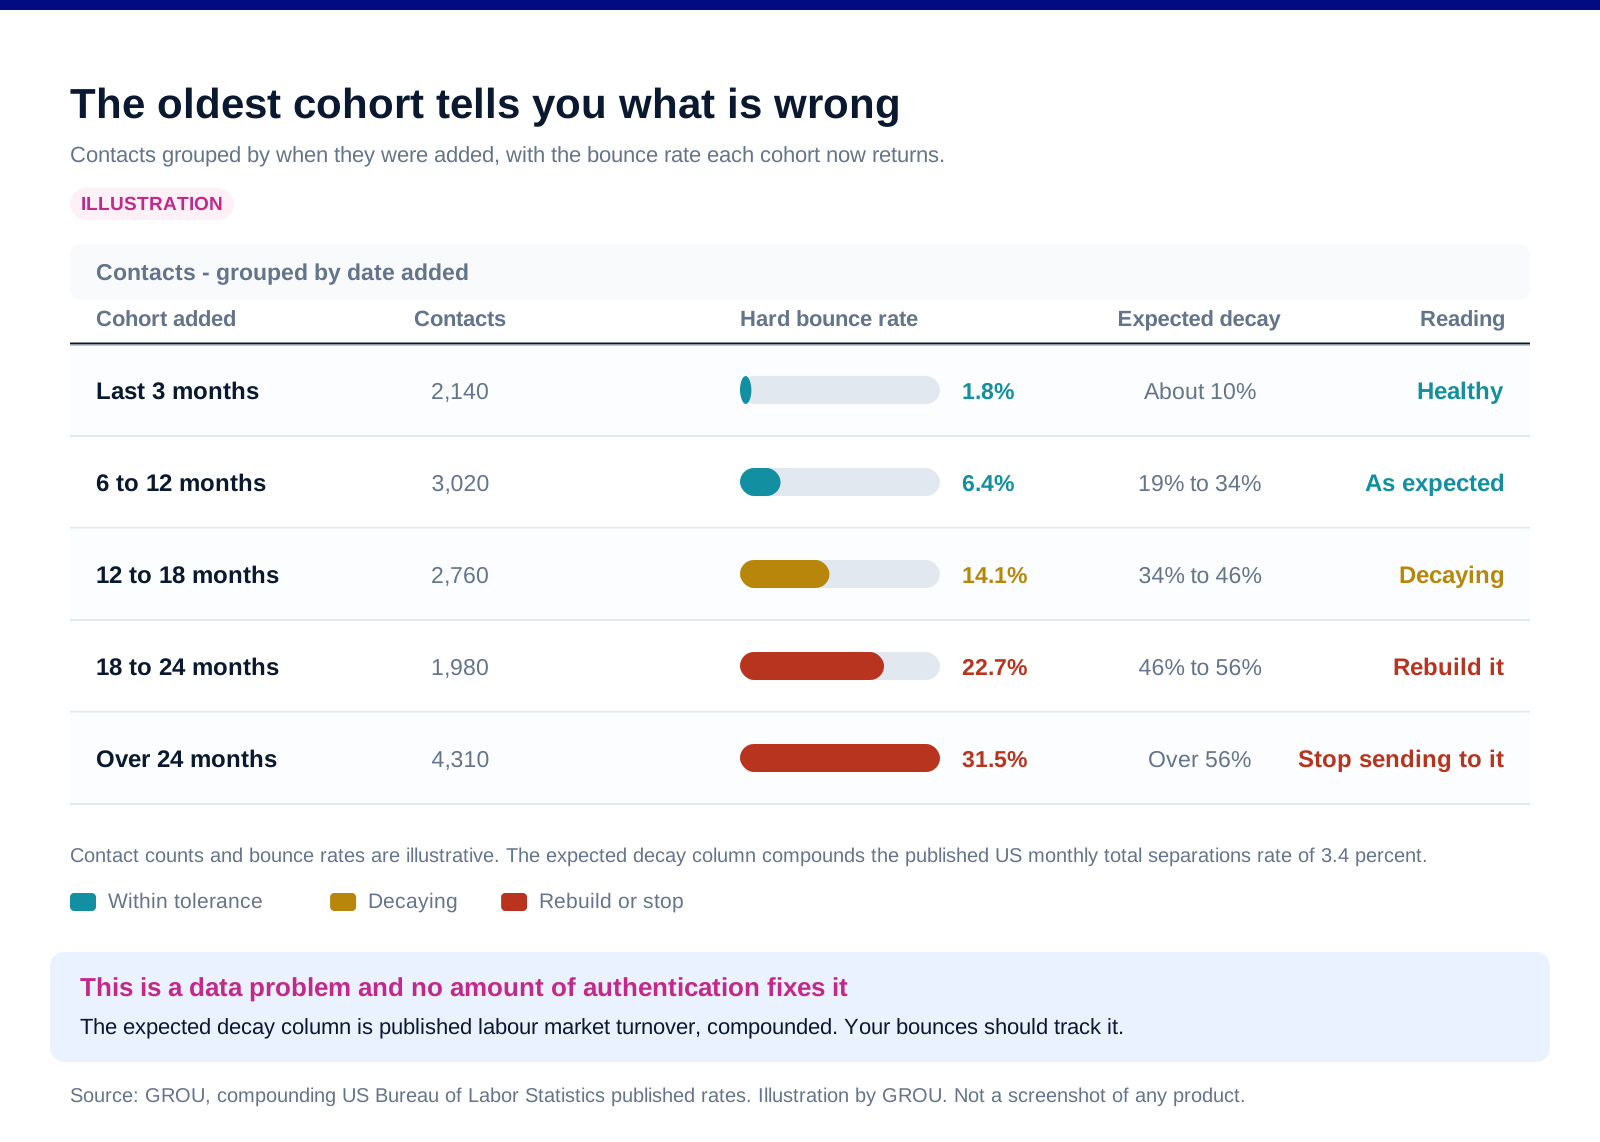
The tell to look for. Hard bounces rising on a list that used to be clean, especially concentrated in the oldest imports. That is not a deliverability problem you can fix with authentication, it is a data problem you fix by rebuilding the list.
And notice what it does to your comparisons. If your reply rate is calculated on a denominator that includes a third of people who no longer hold the job, the rate is wrong in a direction that flatters nobody. Our note on email verification tools covers the hygiene side of this.
Signature three: nothing broke and you are reading noise
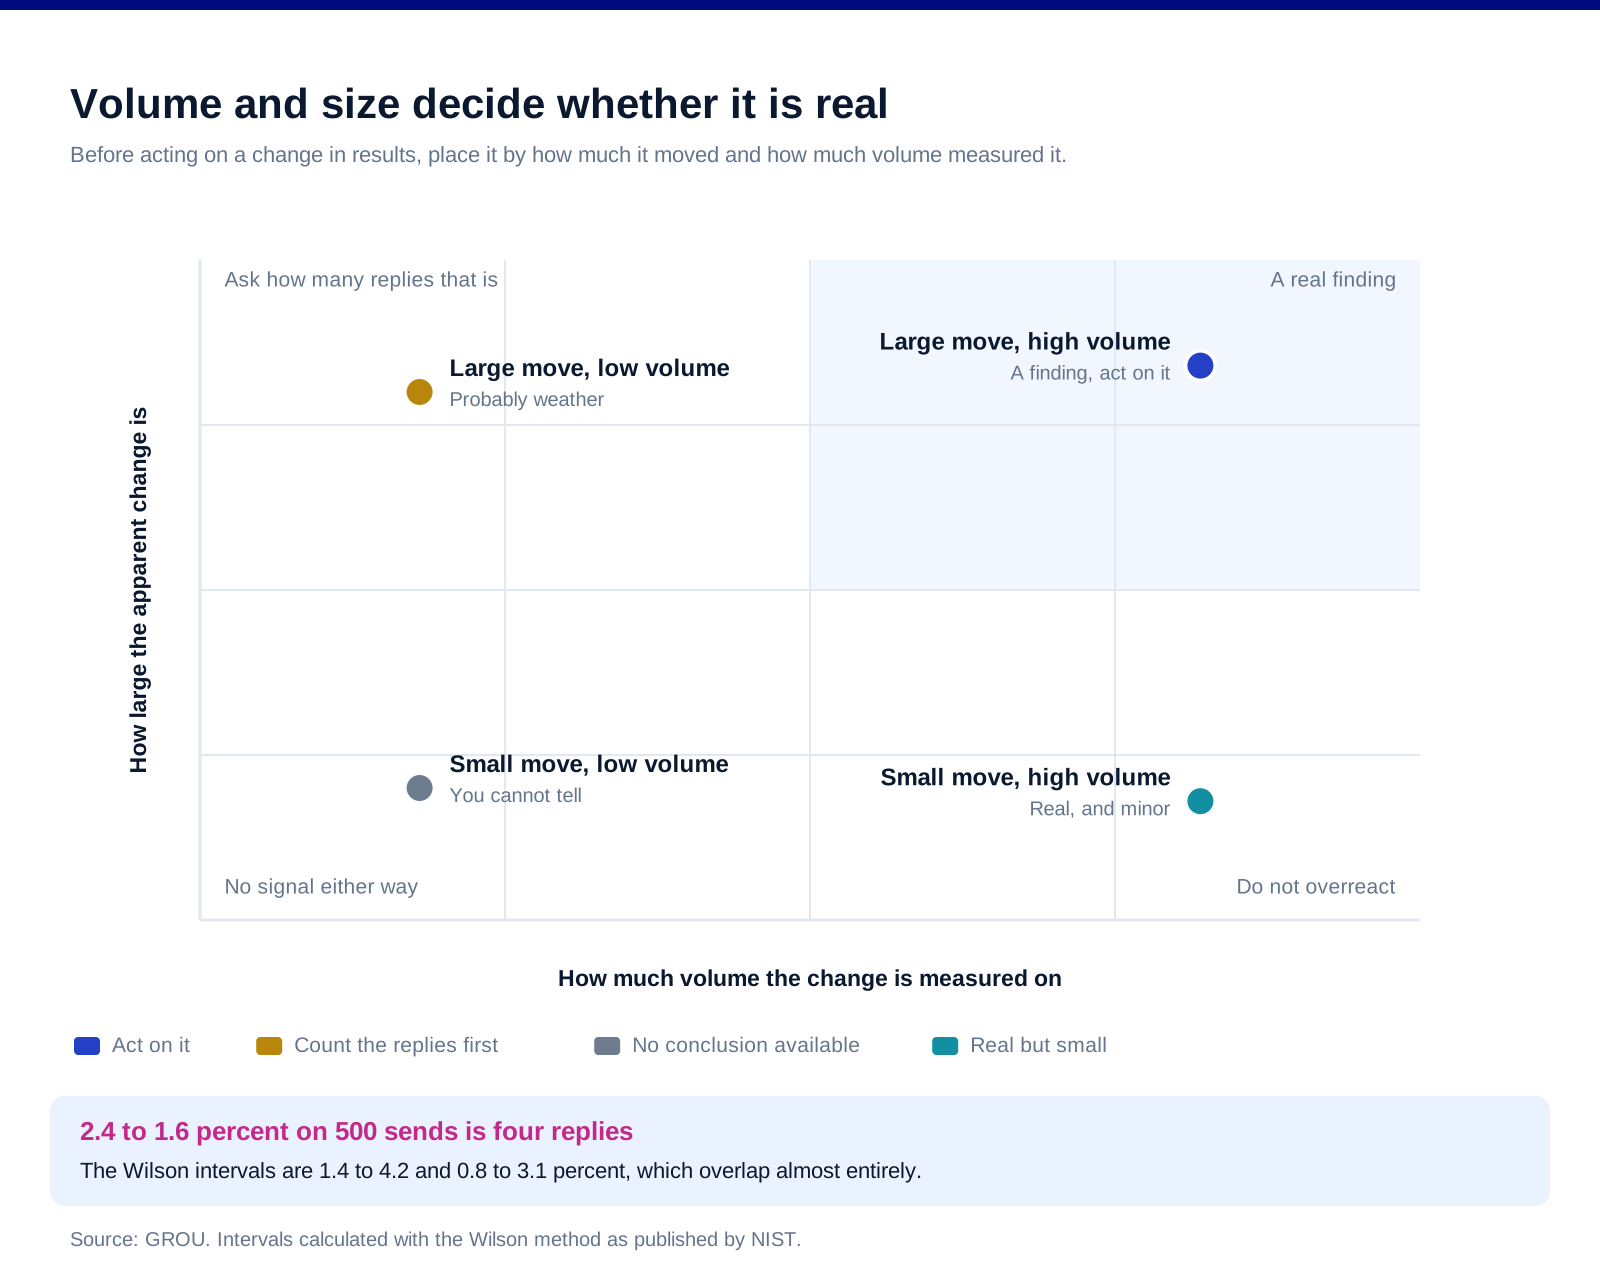
Run the interval before you run the retrospective. The NIST handbook recommends the Wilson method for confidence intervals on a proportion, describing it as "based on inverting the hypothesis test" and noting its advantage that "the lower limit cannot be negative", unlike the simple normal approximation.
Apply it to the decline everyone is worried about. Twelve replies from 500 sends is 2.4 percent, with a 95 percent Wilson interval of 1.4 to 4.2 percent. Eight replies from 500 is 1.6 percent, with an interval of 0.8 to 3.1 percent. Those two intervals overlap across almost their entire range. On 500 sends, a drop from 2.4 to 1.6 percent is four replies, and four replies is weather.
Volume narrows it but does not settle it. The same rates on 2,000 sends give intervals of 1.8 to 3.2 and 1.1 to 2.3 percent. Closer, still overlapping, still not a finding. That is consistent with what it takes to detect a one-point move properly, which we worked through in our piece on when to start outbound.
The tell to look for. The change is being discussed in a meeting, the numbers behind it are two digits, and nobody has said out loud how many replies the difference actually represents. Ask that question first and a good share of these conversations end there.
Which is not an argument for doing nothing. It is an argument for not throwing away a sequence on evidence that could not have shown you anything. Rewriting a working message because of noise is a real cost, and it is invisible, because you never find out what the old one would have done.
Which one you are looking at
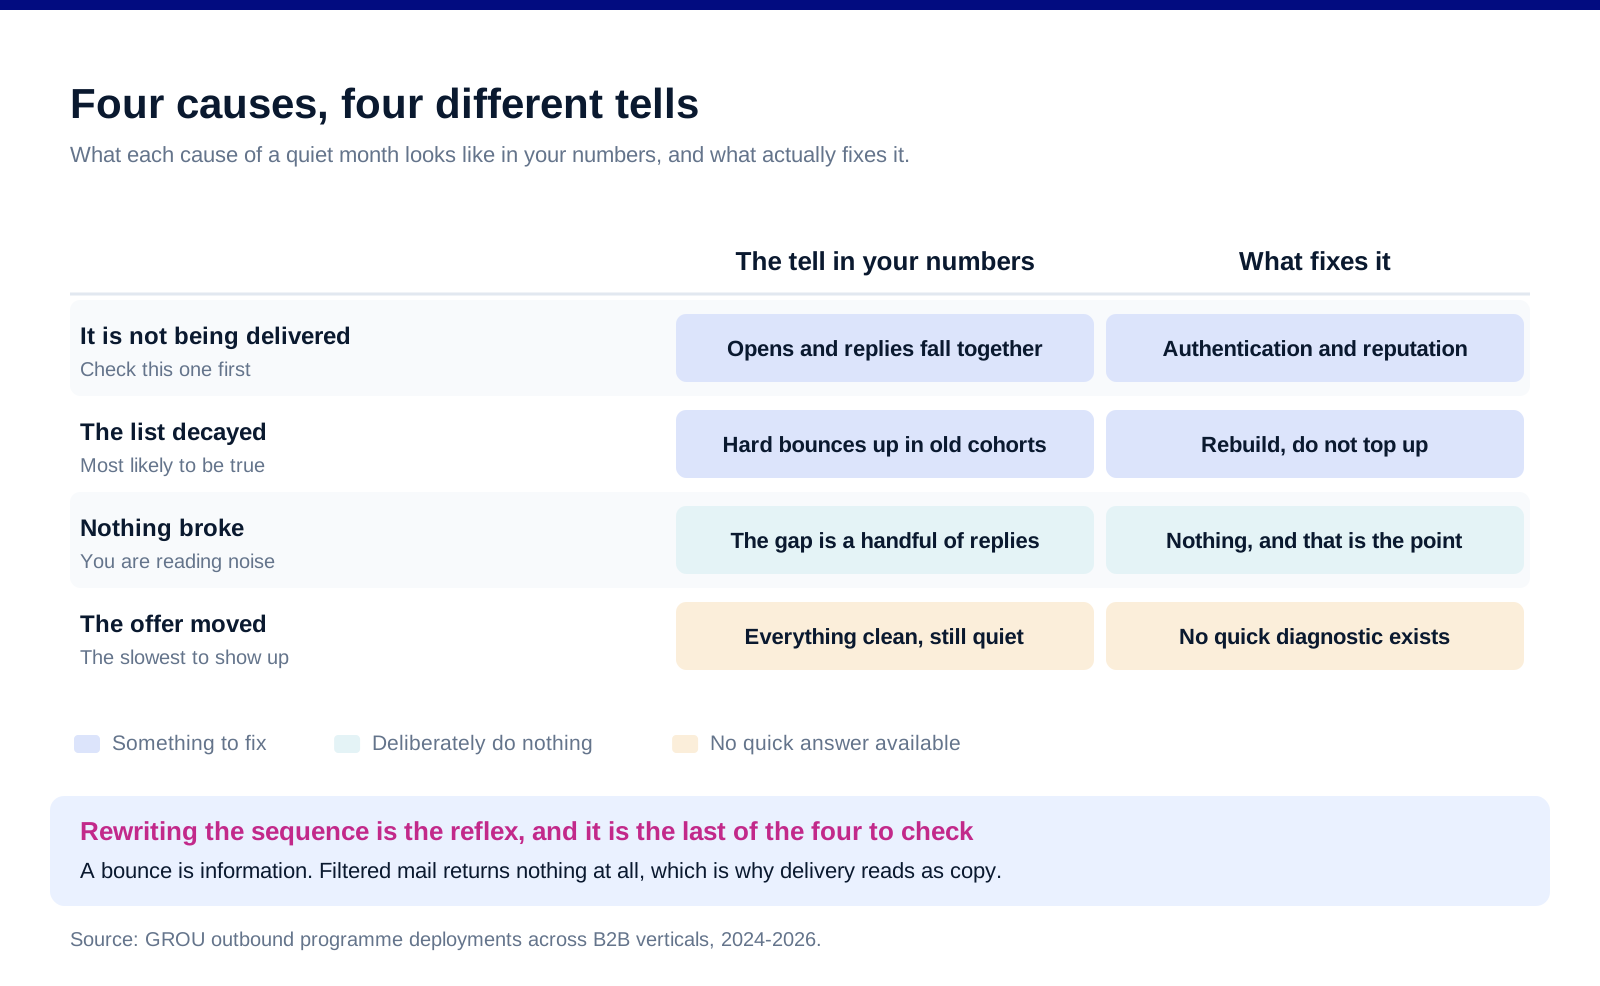
Check delivery first because it is the cheapest to rule out. Bounce codes by class, spam rate against the published thresholds, and a list of every infrastructure change in the last month. An afternoon, and it either finds something or it does not.
Check the data second because it is the most likely to be true. Age of the oldest cohort, bounce rate by cohort, and how long it has been since the list was rebuilt rather than topped up.
Check the arithmetic third because it is the one nobody does. How many replies is the difference, and what does the interval look like at your volume.
Only then look at the message. And when you do, change one thing, on enough volume to learn from, rather than rewriting the sequence end to end. Our note on outbound lead generation covers how to structure that so the next result is interpretable.
There is a fourth cause and it is the slowest to show up. The offer or the market moved. Nothing in your setup is broken, the thing you are saying just matters less than it did. That one has no quick diagnostic, which is exactly why it is worth ruling out the three that do before concluding it.
What we do not publish here
A reply rate benchmark, or any figure for what good looks like. The 2.4 and 1.6 percent above are illustrative inputs for the interval arithmetic, labelled as such, and chosen because they are the shape of decline teams actually argue about.
A bounce rate threshold. Providers publish spam rate thresholds and we quote those. A universal bounce ceiling is not something we have measured cleanly enough to publish.
Decay rates for specific industries or seniorities. The published labour market figures are economy-wide, and slicing them by the segments you sell to is exactly the kind of estimate that would look authoritative and be wrong.
Tool recommendations for diagnosing any of this. The bounce codes, the spam rate and the interval arithmetic are all readable from what you already have.
Any claim that a rewrite never helps. It often does. The argument here is about order of operations, not about whether copy matters.
FAQ
How do you tell a deliverability problem from a copy problem?
Look at whether opens fall with replies or hold steady. If both fall together while hard bounces creep up, the problem is upstream of the message. If opens hold and replies fall, the message is a genuine suspect. Rejected mail returns a status code; filtered mail returns nothing, which is why filtering gets misread as disinterest.
How fast does a B2B contact list go out of date?
Faster than most teams assume. US Bureau of Labor Statistics figures for June 2026 give a monthly quits rate of 2.0 percent and total separations of 3.4 percent. Compounded, that is roughly a third of a list having left their employer within a year and over half within two. Treat it as an order of magnitude rather than a precise decay curve.
Is a drop from 2.4 percent to 1.6 percent a real decline?
Not on small volume. On 500 sends those are twelve replies and eight replies, with 95 percent Wilson intervals of 1.4 to 4.2 and 0.8 to 3.1 percent, which overlap almost entirely. On 2,000 sends the intervals narrow to 1.8 to 3.2 and 1.1 to 2.3 and still overlap. Ask how many replies the difference represents before treating it as a trend.
What should you check first when outbound goes quiet?
Delivery, because it is the cheapest to rule out and the most commonly missed. Read bounces by status class rather than as one total, compare your spam rate against the published thresholds, and list every infrastructure change from the last month. Then check the list's age, then the arithmetic, then the message.
What spam rate is too high?
Google requires all senders to keep the rate reported in Postmaster Tools below 0.3 percent, recommends staying below 0.10 percent, and says to avoid 0.30 percent or higher. Crossing that line explains a quiet month far better than a weaker subject line does.
Should you rewrite the sequence when results fall?
Not first, and not all of it. Rule out delivery, data and noise before touching the copy, then change one element at a time on enough volume to interpret the result. Rewriting a working sequence because of noise is a real cost that never shows up anywhere, because you never learn what the old one would have done.
Bottom line
Work through the three cheap explanations before the expensive one. Delivery goes first: read bounces by status class, because a permanent failure and a transient one are different problems reported under the same word, and check your spam rate against the 0.30 percent line you are actually judged on. Data goes second: at published US separation rates of 3.4 percent a month, about a third of a list has left its employer within a year, so a list you built eighteen months ago and never rebuilt is closer to half wrong than slightly stale. Arithmetic goes third: work out how many replies the decline actually represents and what the interval looks like at your volume, because a fall from 2.4 to 1.6 percent on 500 sends is four replies and four replies is noise. Only when those three come back clean is the message the thing to change, and then change one element on enough volume to learn something rather than rewriting the whole sequence on evidence that could not have told you anything.
Want the programme diagnosed and rebuilt rather than rewritten? Book a call with GROU. We run lead generation and outbound inside B2B revenue engines across verticals.
We are GROU, a B2B pipeline agency that runs lead generation, outbound, and LinkedIn content for clients across manufacturing, fintech, iGaming, software, and professional services. The interval and decay arithmetic is ours and is reproducible from the published formulas and rates cited. The status code definitions, labour market rates and spam rate thresholds are quoted from published RFC Editor, US Bureau of Labor Statistics, NIST and Google sources, verified in August 2026.
When outbound goes quiet, the sequence gets rewritten. Two of the three most common causes are not in the sequence at all, and both are checkable in an afternoon.
The third cause is the one nobody wants to hear, which is that nothing broke and you are reading noise. That one has a test too, and running it before the rewrite has saved more working campaigns than any copy change we have made.
TL;DR
Diagnose in this order, because the cheap checks rule out the expensive rewrite. First, delivery: read your bounce codes by class rather than as one number, since RFC 3463 makes a 5.x.x a permanent failure "not likely to be resolved by resending the message in the current form" and a 4.x.x a persistent transient one, and watch your spam rate against Google's 0.30 percent limit. Second, data: US Bureau of Labor Statistics figures for June 2026 put the monthly quits rate at 2.0 percent and total separations at 3.4 percent, which compounds to roughly a third of a list having left their employer within a year and over half within two. Third, measurement: a fall from 2.4 to 1.6 percent on 500 sends produces Wilson 95 percent intervals of 1.4 to 4.2 and 0.8 to 3.1 percent, which overlap almost entirely, so on that volume you have not observed a decline at all. Only when all three come back clean is the message the thing to change.
Signature one: it is not being delivered
A bounce is information and silence is not. Rejected mail comes back with a code. Filtered mail does not come back at all, it simply never arrives, and in your sending tool it looks identical to a message that landed and was ignored. That is why a delivery problem so often presents as a copy problem.
So read the bounce classes separately. RFC 3463 defines a class 5 status as "a permanent failure", one "not likely to be resolved by resending the message in the current form", and a class 4 as "a persistent transient failure", where the message is valid but a temporary condition delayed it. A 5.1.1 means "the mailbox specified in the address does not exist". A 4.2.2 means the mailbox is full. Those are a data problem and a nothing, and most tools report both as "bounced".
Then look at the rate you are actually judged on. Google's sender guidelines require all senders to keep spam rates reported in Postmaster Tools below 0.3 percent, and recommend staying below 0.10 percent while avoiding 0.30 percent or higher. A campaign that crossed that line last month explains a quiet inbox this month far better than a weaker subject line does.
The tell to look for. Replies fall and opens fall roughly in step, while hard bounces creep upward. That pattern is upstream of the message. If replies fall while opens hold, the message is a live suspect again.
And check whether anything changed on your side. New sending domain, new tool, a mailbox added, a DNS record edited by someone tidying up. Delivery breaks on changes, and the change is usually two weeks before the symptom. Our email deliverability guide covers the setup that this is testing.
Signature two: the list decayed underneath you
Contact lists rot at a rate you can look up. The US Bureau of Labor Statistics reported a quits rate of 2.0 percent and a total separations rate of 3.4 percent for June 2026, defining quits as "generally voluntary separations initiated by the employee" and total separations as including "quits, layoffs and discharges, and other separations".
Compound that and the numbers get uncomfortable. At 3.4 percent a month, roughly 19 percent of a list has left its employer after six months, about 34 percent after a year, and about 56 percent after two. On the quits rate alone it is about 11 percent, 22 percent and 38 percent. A list built eighteen months ago and never refreshed is closer to half wrong than to slightly stale.
Treat those as indicative rather than exact. They are US figures, they are economy-wide rather than specific to the roles you sell to, and compounding a monthly rate assumes a uniformity that real populations do not have. Senior roles in stable industries move slower, and early-career roles in fast-growing sectors move much faster. The point is the order of magnitude, not the decimal.
The tell to look for. Hard bounces rising on a list that used to be clean, especially concentrated in the oldest imports. That is not a deliverability problem you can fix with authentication, it is a data problem you fix by rebuilding the list.
And notice what it does to your comparisons. If your reply rate is calculated on a denominator that includes a third of people who no longer hold the job, the rate is wrong in a direction that flatters nobody. Our note on email verification tools covers the hygiene side of this.
Signature three: nothing broke and you are reading noise
Run the interval before you run the retrospective. The NIST handbook recommends the Wilson method for confidence intervals on a proportion, describing it as "based on inverting the hypothesis test" and noting its advantage that "the lower limit cannot be negative", unlike the simple normal approximation.
Apply it to the decline everyone is worried about. Twelve replies from 500 sends is 2.4 percent, with a 95 percent Wilson interval of 1.4 to 4.2 percent. Eight replies from 500 is 1.6 percent, with an interval of 0.8 to 3.1 percent. Those two intervals overlap across almost their entire range. On 500 sends, a drop from 2.4 to 1.6 percent is four replies, and four replies is weather.
Volume narrows it but does not settle it. The same rates on 2,000 sends give intervals of 1.8 to 3.2 and 1.1 to 2.3 percent. Closer, still overlapping, still not a finding. That is consistent with what it takes to detect a one-point move properly, which we worked through in our piece on when to start outbound.
The tell to look for. The change is being discussed in a meeting, the numbers behind it are two digits, and nobody has said out loud how many replies the difference actually represents. Ask that question first and a good share of these conversations end there.
Which is not an argument for doing nothing. It is an argument for not throwing away a sequence on evidence that could not have shown you anything. Rewriting a working message because of noise is a real cost, and it is invisible, because you never find out what the old one would have done.
Which one you are looking at
Check delivery first because it is the cheapest to rule out. Bounce codes by class, spam rate against the published thresholds, and a list of every infrastructure change in the last month. An afternoon, and it either finds something or it does not.
Check the data second because it is the most likely to be true. Age of the oldest cohort, bounce rate by cohort, and how long it has been since the list was rebuilt rather than topped up.
Check the arithmetic third because it is the one nobody does. How many replies is the difference, and what does the interval look like at your volume.
Only then look at the message. And when you do, change one thing, on enough volume to learn from, rather than rewriting the sequence end to end. Our note on outbound lead generation covers how to structure that so the next result is interpretable.
There is a fourth cause and it is the slowest to show up. The offer or the market moved. Nothing in your setup is broken, the thing you are saying just matters less than it did. That one has no quick diagnostic, which is exactly why it is worth ruling out the three that do before concluding it.
What we do not publish here
A reply rate benchmark, or any figure for what good looks like. The 2.4 and 1.6 percent above are illustrative inputs for the interval arithmetic, labelled as such, and chosen because they are the shape of decline teams actually argue about.
A bounce rate threshold. Providers publish spam rate thresholds and we quote those. A universal bounce ceiling is not something we have measured cleanly enough to publish.
Decay rates for specific industries or seniorities. The published labour market figures are economy-wide, and slicing them by the segments you sell to is exactly the kind of estimate that would look authoritative and be wrong.
Tool recommendations for diagnosing any of this. The bounce codes, the spam rate and the interval arithmetic are all readable from what you already have.
Any claim that a rewrite never helps. It often does. The argument here is about order of operations, not about whether copy matters.
FAQ
How do you tell a deliverability problem from a copy problem?
Look at whether opens fall with replies or hold steady. If both fall together while hard bounces creep up, the problem is upstream of the message. If opens hold and replies fall, the message is a genuine suspect. Rejected mail returns a status code; filtered mail returns nothing, which is why filtering gets misread as disinterest.
How fast does a B2B contact list go out of date?
Faster than most teams assume. US Bureau of Labor Statistics figures for June 2026 give a monthly quits rate of 2.0 percent and total separations of 3.4 percent. Compounded, that is roughly a third of a list having left their employer within a year and over half within two. Treat it as an order of magnitude rather than a precise decay curve.
Is a drop from 2.4 percent to 1.6 percent a real decline?
Not on small volume. On 500 sends those are twelve replies and eight replies, with 95 percent Wilson intervals of 1.4 to 4.2 and 0.8 to 3.1 percent, which overlap almost entirely. On 2,000 sends the intervals narrow to 1.8 to 3.2 and 1.1 to 2.3 and still overlap. Ask how many replies the difference represents before treating it as a trend.
What should you check first when outbound goes quiet?
Delivery, because it is the cheapest to rule out and the most commonly missed. Read bounces by status class rather than as one total, compare your spam rate against the published thresholds, and list every infrastructure change from the last month. Then check the list's age, then the arithmetic, then the message.
What spam rate is too high?
Google requires all senders to keep the rate reported in Postmaster Tools below 0.3 percent, recommends staying below 0.10 percent, and says to avoid 0.30 percent or higher. Crossing that line explains a quiet month far better than a weaker subject line does.
Should you rewrite the sequence when results fall?
Not first, and not all of it. Rule out delivery, data and noise before touching the copy, then change one element at a time on enough volume to interpret the result. Rewriting a working sequence because of noise is a real cost that never shows up anywhere, because you never learn what the old one would have done.
Bottom line
Work through the three cheap explanations before the expensive one. Delivery goes first: read bounces by status class, because a permanent failure and a transient one are different problems reported under the same word, and check your spam rate against the 0.30 percent line you are actually judged on. Data goes second: at published US separation rates of 3.4 percent a month, about a third of a list has left its employer within a year, so a list you built eighteen months ago and never rebuilt is closer to half wrong than slightly stale. Arithmetic goes third: work out how many replies the decline actually represents and what the interval looks like at your volume, because a fall from 2.4 to 1.6 percent on 500 sends is four replies and four replies is noise. Only when those three come back clean is the message the thing to change, and then change one element on enough volume to learn something rather than rewriting the whole sequence on evidence that could not have told you anything.
Want the programme diagnosed and rebuilt rather than rewritten? Book a call with GROU. We run lead generation and outbound inside B2B revenue engines across verticals.
We are GROU, a B2B pipeline agency that runs lead generation, outbound, and LinkedIn content for clients across manufacturing, fintech, iGaming, software, and professional services. The interval and decay arithmetic is ours and is reproducible from the published formulas and rates cited. The status code definitions, labour market rates and spam rate thresholds are quoted from published RFC Editor, US Bureau of Labor Statistics, NIST and Google sources, verified in August 2026.
When outbound goes quiet, the sequence gets rewritten. Two of the three most common causes are not in the sequence at all, and both are checkable in an afternoon.
The third cause is the one nobody wants to hear, which is that nothing broke and you are reading noise. That one has a test too, and running it before the rewrite has saved more working campaigns than any copy change we have made.
TL;DR
Diagnose in this order, because the cheap checks rule out the expensive rewrite. First, delivery: read your bounce codes by class rather than as one number, since RFC 3463 makes a 5.x.x a permanent failure "not likely to be resolved by resending the message in the current form" and a 4.x.x a persistent transient one, and watch your spam rate against Google's 0.30 percent limit. Second, data: US Bureau of Labor Statistics figures for June 2026 put the monthly quits rate at 2.0 percent and total separations at 3.4 percent, which compounds to roughly a third of a list having left their employer within a year and over half within two. Third, measurement: a fall from 2.4 to 1.6 percent on 500 sends produces Wilson 95 percent intervals of 1.4 to 4.2 and 0.8 to 3.1 percent, which overlap almost entirely, so on that volume you have not observed a decline at all. Only when all three come back clean is the message the thing to change.
Signature one: it is not being delivered
A bounce is information and silence is not. Rejected mail comes back with a code. Filtered mail does not come back at all, it simply never arrives, and in your sending tool it looks identical to a message that landed and was ignored. That is why a delivery problem so often presents as a copy problem.
So read the bounce classes separately. RFC 3463 defines a class 5 status as "a permanent failure", one "not likely to be resolved by resending the message in the current form", and a class 4 as "a persistent transient failure", where the message is valid but a temporary condition delayed it. A 5.1.1 means "the mailbox specified in the address does not exist". A 4.2.2 means the mailbox is full. Those are a data problem and a nothing, and most tools report both as "bounced".
Then look at the rate you are actually judged on. Google's sender guidelines require all senders to keep spam rates reported in Postmaster Tools below 0.3 percent, and recommend staying below 0.10 percent while avoiding 0.30 percent or higher. A campaign that crossed that line last month explains a quiet inbox this month far better than a weaker subject line does.
The tell to look for. Replies fall and opens fall roughly in step, while hard bounces creep upward. That pattern is upstream of the message. If replies fall while opens hold, the message is a live suspect again.
And check whether anything changed on your side. New sending domain, new tool, a mailbox added, a DNS record edited by someone tidying up. Delivery breaks on changes, and the change is usually two weeks before the symptom. Our email deliverability guide covers the setup that this is testing.
Signature two: the list decayed underneath you
Contact lists rot at a rate you can look up. The US Bureau of Labor Statistics reported a quits rate of 2.0 percent and a total separations rate of 3.4 percent for June 2026, defining quits as "generally voluntary separations initiated by the employee" and total separations as including "quits, layoffs and discharges, and other separations".
Compound that and the numbers get uncomfortable. At 3.4 percent a month, roughly 19 percent of a list has left its employer after six months, about 34 percent after a year, and about 56 percent after two. On the quits rate alone it is about 11 percent, 22 percent and 38 percent. A list built eighteen months ago and never refreshed is closer to half wrong than to slightly stale.
Treat those as indicative rather than exact. They are US figures, they are economy-wide rather than specific to the roles you sell to, and compounding a monthly rate assumes a uniformity that real populations do not have. Senior roles in stable industries move slower, and early-career roles in fast-growing sectors move much faster. The point is the order of magnitude, not the decimal.
The tell to look for. Hard bounces rising on a list that used to be clean, especially concentrated in the oldest imports. That is not a deliverability problem you can fix with authentication, it is a data problem you fix by rebuilding the list.
And notice what it does to your comparisons. If your reply rate is calculated on a denominator that includes a third of people who no longer hold the job, the rate is wrong in a direction that flatters nobody. Our note on email verification tools covers the hygiene side of this.
Signature three: nothing broke and you are reading noise
Run the interval before you run the retrospective. The NIST handbook recommends the Wilson method for confidence intervals on a proportion, describing it as "based on inverting the hypothesis test" and noting its advantage that "the lower limit cannot be negative", unlike the simple normal approximation.
Apply it to the decline everyone is worried about. Twelve replies from 500 sends is 2.4 percent, with a 95 percent Wilson interval of 1.4 to 4.2 percent. Eight replies from 500 is 1.6 percent, with an interval of 0.8 to 3.1 percent. Those two intervals overlap across almost their entire range. On 500 sends, a drop from 2.4 to 1.6 percent is four replies, and four replies is weather.
Volume narrows it but does not settle it. The same rates on 2,000 sends give intervals of 1.8 to 3.2 and 1.1 to 2.3 percent. Closer, still overlapping, still not a finding. That is consistent with what it takes to detect a one-point move properly, which we worked through in our piece on when to start outbound.
The tell to look for. The change is being discussed in a meeting, the numbers behind it are two digits, and nobody has said out loud how many replies the difference actually represents. Ask that question first and a good share of these conversations end there.
Which is not an argument for doing nothing. It is an argument for not throwing away a sequence on evidence that could not have shown you anything. Rewriting a working message because of noise is a real cost, and it is invisible, because you never find out what the old one would have done.
Which one you are looking at
Check delivery first because it is the cheapest to rule out. Bounce codes by class, spam rate against the published thresholds, and a list of every infrastructure change in the last month. An afternoon, and it either finds something or it does not.
Check the data second because it is the most likely to be true. Age of the oldest cohort, bounce rate by cohort, and how long it has been since the list was rebuilt rather than topped up.
Check the arithmetic third because it is the one nobody does. How many replies is the difference, and what does the interval look like at your volume.
Only then look at the message. And when you do, change one thing, on enough volume to learn from, rather than rewriting the sequence end to end. Our note on outbound lead generation covers how to structure that so the next result is interpretable.
There is a fourth cause and it is the slowest to show up. The offer or the market moved. Nothing in your setup is broken, the thing you are saying just matters less than it did. That one has no quick diagnostic, which is exactly why it is worth ruling out the three that do before concluding it.
What we do not publish here
A reply rate benchmark, or any figure for what good looks like. The 2.4 and 1.6 percent above are illustrative inputs for the interval arithmetic, labelled as such, and chosen because they are the shape of decline teams actually argue about.
A bounce rate threshold. Providers publish spam rate thresholds and we quote those. A universal bounce ceiling is not something we have measured cleanly enough to publish.
Decay rates for specific industries or seniorities. The published labour market figures are economy-wide, and slicing them by the segments you sell to is exactly the kind of estimate that would look authoritative and be wrong.
Tool recommendations for diagnosing any of this. The bounce codes, the spam rate and the interval arithmetic are all readable from what you already have.
Any claim that a rewrite never helps. It often does. The argument here is about order of operations, not about whether copy matters.
FAQ
How do you tell a deliverability problem from a copy problem?
Look at whether opens fall with replies or hold steady. If both fall together while hard bounces creep up, the problem is upstream of the message. If opens hold and replies fall, the message is a genuine suspect. Rejected mail returns a status code; filtered mail returns nothing, which is why filtering gets misread as disinterest.
How fast does a B2B contact list go out of date?
Faster than most teams assume. US Bureau of Labor Statistics figures for June 2026 give a monthly quits rate of 2.0 percent and total separations of 3.4 percent. Compounded, that is roughly a third of a list having left their employer within a year and over half within two. Treat it as an order of magnitude rather than a precise decay curve.
Is a drop from 2.4 percent to 1.6 percent a real decline?
Not on small volume. On 500 sends those are twelve replies and eight replies, with 95 percent Wilson intervals of 1.4 to 4.2 and 0.8 to 3.1 percent, which overlap almost entirely. On 2,000 sends the intervals narrow to 1.8 to 3.2 and 1.1 to 2.3 and still overlap. Ask how many replies the difference represents before treating it as a trend.
What should you check first when outbound goes quiet?
Delivery, because it is the cheapest to rule out and the most commonly missed. Read bounces by status class rather than as one total, compare your spam rate against the published thresholds, and list every infrastructure change from the last month. Then check the list's age, then the arithmetic, then the message.
What spam rate is too high?
Google requires all senders to keep the rate reported in Postmaster Tools below 0.3 percent, recommends staying below 0.10 percent, and says to avoid 0.30 percent or higher. Crossing that line explains a quiet month far better than a weaker subject line does.
Should you rewrite the sequence when results fall?
Not first, and not all of it. Rule out delivery, data and noise before touching the copy, then change one element at a time on enough volume to interpret the result. Rewriting a working sequence because of noise is a real cost that never shows up anywhere, because you never learn what the old one would have done.
Bottom line
Work through the three cheap explanations before the expensive one. Delivery goes first: read bounces by status class, because a permanent failure and a transient one are different problems reported under the same word, and check your spam rate against the 0.30 percent line you are actually judged on. Data goes second: at published US separation rates of 3.4 percent a month, about a third of a list has left its employer within a year, so a list you built eighteen months ago and never rebuilt is closer to half wrong than slightly stale. Arithmetic goes third: work out how many replies the decline actually represents and what the interval looks like at your volume, because a fall from 2.4 to 1.6 percent on 500 sends is four replies and four replies is noise. Only when those three come back clean is the message the thing to change, and then change one element on enough volume to learn something rather than rewriting the whole sequence on evidence that could not have told you anything.
Want the programme diagnosed and rebuilt rather than rewritten? Book a call with GROU. We run lead generation and outbound inside B2B revenue engines across verticals.
We are GROU, a B2B pipeline agency that runs lead generation, outbound, and LinkedIn content for clients across manufacturing, fintech, iGaming, software, and professional services. The interval and decay arithmetic is ours and is reproducible from the published formulas and rates cited. The status code definitions, labour market rates and spam rate thresholds are quoted from published RFC Editor, US Bureau of Labor Statistics, NIST and Google sources, verified in August 2026.

Pipeline OS Newsletter
Build qualified pipeline
Get weekly tactics to generate demand, improve lead quality, and book more meetings.





Trusted by industry leaders
Trusted by industry leaders
Trusted by industry leaders
Ready to build qualified pipeline?
Ready to build qualified pipeline?
Ready to build qualified pipeline?
Book a call to see if we're the right fit, or take the 2-minute quiz to get a clear starting point.
Book a call to see if we're the right fit, or take the 2-minute quiz to get a clear starting point.
Book a call to see if we're the right fit, or take the 2-minute quiz to get a clear starting point.
" height="30.21639343089746px" id="hfGbXmQR2" width="30.216393430897455px"/></svg>)
Copyright © 2026 – All Right Reserved
Copyright © 2026 – All Right Reserved
Copyright © 2026 – All Right Reserved