%22%3E%3C/path%3E%3Cpath d=%22M 63.072 7.554 C 62.258 8.022 61.577 8.689 61.092 9.493 L 61.092 7.076 L 57.158 7.076 L 57.158 22.64 L 61.089 22.64 L 61.089 14.888 C 61.089 13.446 61.403 12.434 62.03 11.853 C 62.818 11.218 63.818 10.907 64.826 10.982 L 65.868 10.982 L 65.868 6.851 C 64.891 6.834 63.926 7.076 63.073 7.554 Z%22 fill=%22rgb(17,17,17)%22%3E%3C/path%3E%3Cpath d=%22M 78.916 7.82 C 76.363 6.49 73.321 6.49 70.768 7.82 C 69.562 8.473 68.564 9.451 67.888 10.644 C 67.167 11.931 66.803 13.387 66.834 14.862 C 66.804 16.332 67.157 17.785 67.86 19.077 C 68.515 20.267 69.494 21.246 70.684 21.901 C 71.924 22.576 73.318 22.92 74.73 22.898 C 76.164 22.918 77.58 22.575 78.846 21.901 C 80.062 21.247 81.073 20.27 81.768 19.077 C 82.506 17.797 82.88 16.339 82.85 14.862 C 82.88 13.389 82.517 11.934 81.797 10.647 C 81.12 9.455 80.122 8.477 78.917 7.824 M 78.803 14.862 C 78.829 15.739 78.636 16.608 78.241 17.391 C 77.903 18.046 77.38 18.588 76.738 18.95 C 76.124 19.293 75.432 19.472 74.729 19.47 C 73.668 19.497 72.648 19.061 71.934 18.276 C 71.139 17.323 70.741 16.1 70.823 14.862 C 70.741 13.62 71.149 12.395 71.959 11.45 C 72.687 10.667 73.715 10.233 74.783 10.256 C 75.859 10.236 76.894 10.67 77.635 11.45 C 78.464 12.387 78.884 13.616 78.801 14.864%22 fill=%22rgb(17,17,17)%22%3E%3C/path%3E%3Cpath d=%22M 95.906 7.076 L 95.906 15.646 C 95.975 16.68 95.643 17.701 94.979 18.498 C 94.311 19.184 93.379 19.547 92.422 19.495 C 91.475 19.544 90.553 19.18 89.894 18.498 C 89.23 17.701 88.898 16.68 88.967 15.646 L 88.967 7.076 L 85.033 7.076 L 85.033 16.207 C 85 17.449 85.275 18.68 85.834 19.79 C 86.327 20.75 87.095 21.542 88.039 22.065 C 89.033 22.594 90.145 22.861 91.271 22.838 C 92.188 22.847 93.095 22.65 93.926 22.263 C 94.708 21.905 95.388 21.36 95.906 20.675 L 95.906 22.645 L 99.865 22.645 L 99.865 7.076 Z%22 fill=%22rgb(17,17,17)%22%3E%3C/path%3E%3Cpath d=%22M 4.513 15.626 C 4.511 10.815 7.606 6.549 12.181 5.059 C 16.756 3.57 21.77 5.195 24.601 9.086 L 27.816 5.87 C 24.074 1.186 17.981 -0.943 12.137 0.393 C 6.292 1.728 1.728 6.292 0.393 12.137 C -0.943 17.981 1.186 24.074 5.87 27.816 L 9.085 24.601 C 6.214 22.512 4.515 19.177 4.513 15.626%22 fill=%22rgb(32,62,235)%22%3E%3C/path%3E%3Cpath d=%22M 17.114 14.343 L 13.354 18.01 L 13.354 18.026 L 21.071 18.026 L 11.412 27.609 L 17.389 27.609 L 23.999 21.081 L 23.999 28.316 L 24.005 28.316 L 27.967 24.393 L 27.967 14.343 Z%22 fill=%22rgb(32,62,235)%22%3E%3C/path%3E%3C/g%3E%3C/svg%3E) ×
× ××
××›
›
›
›
Sales cycle length: B2B benchmarks and fixes for 2026
Sales cycle length: B2B benchmarks and fixes for 2026
Sales cycle length: B2B benchmarks and fixes for 2026
Sales cycle length: B2B benchmarks and fixes for 2026
Sales cycle length: B2B benchmarks and fixes for 2026
Sales cycle length: B2B benchmarks and fixes for 2026

Author
Aljaz Peklaj

Deals are sitting in the middle of the funnel while leadership asks for faster closes without adding headcount. The answer usually isn't more activity. It's a cleaner system for routing replies, qualifying fit, and exposing the stage where time is being lost.
→ Benchmark by segment: ACV, buying committee size, and procurement complexity matter more than one blended average.
→ Separate clocks: Total cycle time and active buying time reveal different problems.
→ Fix internal friction: Routing delays, loose ICP rules, and poor CRM visibility often slow the front of the cycle.
→ Forecast from stage data: Shared definitions and time-in-stage reporting produce more useful decisions than headline averages.
Table of Contents
The reality of modern pipeline velocity
B2B sales cycles have stretched. One 2026 benchmark places the median cycle at 84 days across B2B SaaS companies, compared with about 118 days across industries, and reports that cycles have lengthened 22% since 2022. The same benchmark estimates that each additional decision-maker adds 8 to 15 days to the process. See the pipeline velocity framework for the connection between cycle length, deal value, opportunity volume, and win rate.
That movement changes how founders should read a forecast. A pipeline can contain enough nominal coverage and still miss the quarter because every deal now requires more internal agreement, security review, procurement work, or legal input. Sales cycle length is therefore a revenue operations issue, not just a sales manager's coaching metric.
The historical view reinforces the point. One benchmark summary reports an average B2B cycle of 6.5 months in 2025, compared with 4.9 months in 2019, while another places a mid-market median at 92 days in 2026, up from 68 days in 2019. These figures use different methodologies, so they shouldn't be combined into one universal target. They do show a consistent direction.
Practical rule: Treat the published benchmark as a reference range. Treat your own stage history as the operating truth.
Total time hides the actual delay
A deal can spend little time in active evaluation and still take a long time from first touch to signature. Research and qualification may happen before opportunity creation, then procurement and legal may add time after the commercial decision is mostly made. Comparing these periods as one number makes the bottleneck difficult to locate.
Industry pipeline analysis places the blended B2B average at 102 days, with 84 days from lead to opportunity and 18 days from opportunity to close. That split suggests that much of the delay accumulates before formal opportunity creation, rather than during final negotiation. Sales cycle KPIs and tips can help teams map those stages without treating every opportunity as if it followed the same path.
For a founder, the operational question is simple: where does the clock expand? If replies wait for manual review, the issue is routing. If meetings are booked with poor-fit accounts, the issue is qualification. If qualified opportunities sit without a next action, the issue is sales execution or buying-process control.
The rest of the system should answer those questions with evidence. Don't ask reps to “move faster” until the CRM shows which handoff, stage, or approval is responsible for the delay.
Sales cycle length benchmarks by deal size
A universal B2B average is a poor planning tool. A low-value SaaS purchase and a complex manufacturing contract may both appear in the same revenue report, but their buying mechanics are different from the start.
The clearest operational rule is to segment by ACV first, then by buyer group and approval path. One benchmark groups deals under $10,000 into a 2 to 3 month cycle, deals from $10,000 to $100,000 into 3 to 6 months, enterprise deals above $100,000 into 6 to 12 months, and complex enterprise deals above $500,000 into 12 to 18 months. The benchmark is documented in B2B sales benchmarks.
B2B cycle benchmarks by ACV
Deal size (ACV) | Expected cycle length | Primary delay driver |
|---|---|---|
SMB SaaS under $15,000 | 14 to 30 days | Limited approval path and smaller buying group |
Mid-market SaaS from $15,000 to $100,000 | 30 to 90 days | Evaluation, budget approval, and stakeholder alignment |
Enterprise above $100,000 | 90 to 180+ days | Security, procurement, legal, and multi-stakeholder consensus |
Enterprise above $500,000 | 12 to 18 months | Commercial risk, formal approvals, and complex implementation planning |
A separate 2026 SaaS benchmark reports the same broad segment pattern, with 14 to 30 days for SMB deals, 30 to 90 days for mid-market deals, and 90 to 180+ days for enterprise deals. It also links the longer cycle to buying committees growing from 5.4 to 6.8 stakeholders and to deeper security due diligence. Those figures come from a benchmark based on 939 B2B companies.
That stakeholder effect matters more than many teams admit. The 2026 benchmark cited earlier estimates 8 to 15 additional days per decision-maker. A larger committee creates more scheduling work, more requirements, and more opportunities for an internal objection to pause the deal.
Compare like with like
An SMB SaaS deal can close in a few weeks because the buyer may control the budget and the implementation risk is contained. A manufacturing purchase can involve engineering, operations, finance, procurement, and executive approval. The vendor may also need to support customization, prototyping, compliance review, or site-specific planning.
This is why a single average can produce bad coverage assumptions. If your CRM reports one cycle length across iGaming, SaaS, manufacturing, legal tech, and pharma, the result is a blended number that describes none of those motions well.
Use separate benchmarks for → ACV → segment → buying committee size → approval path. Then compare each segment with its own trailing history. A longer cycle isn't automatically a problem. A cycle that exceeds the normal range for its segment, without a documented reason, deserves investigation.
How to measure pipeline velocity in your CRM
Start by fixing the clock. For opportunity-based reporting, define sales cycle length as:
Closed-won date minus opportunity-created date = sales cycle length in days
That measures the selling process after an opportunity enters the active pipeline. It doesn't measure the entire journey from first touch, so store both dates when possible. The first-touch clock helps marketing and outbound teams assess front-end performance. The opportunity clock helps sales and RevOps assess deal progression.
Set the definitions before building the dashboard
Write the definitions in the CRM administration document and make them part of the required field logic.
Sales accepted lead: A lead that meets the agreed fit rules and has been accepted by sales for follow-up.
SQL: A lead that has met the team's qualification threshold and has a documented sales reason to progress.
Accepted meeting: A meeting that took place, involved the intended account or contact, and met the agreed qualification standard.
Attributed pipeline: An opportunity linked to a defined marketing or outbound source, with the attribution model recorded.
Don't change these definitions mid-quarter. If an accepted meeting means “booked” in one month and “held plus qualified” in the next, conversion reporting becomes a labeling exercise.
CRM rule: Every stage needs an entry timestamp, an exit timestamp, an owner, and a reason for disqualification or regression.
In HubSpot, create date properties for first touch, sales acceptance, SQL, meeting held, opportunity creation, and closed won. Use workflows to populate timestamps when lifecycle or deal-stage values change. In Salesforce, use date fields with record-triggered flows, then report on the difference between those fields. Avoid relying only on the current stage, because a current-stage report cannot show how long a deal spent in a previous stage.
Build the stage queries
Your dashboard should answer five questions:
How long does each stage take? Use the median time from stage entry to stage exit, segmented by deal size and motion.
Where do deals stop? Count opportunities with no stage change or next-step update during the team's agreed review window.
How many accepted leads become SQLs? Divide SQLs by sales accepted leads for the same cohort.
How many meetings become opportunities? Divide opportunity creation events by accepted meetings, using the same source and period.
How much sourced pipeline progresses? Group attributed opportunities by source, stage, amount, and age.
The core pipeline velocity formula is:
Velocity = opportunities × average deal value × win rate ÷ sales cycle length
Keep the variables in the same period and segment. A mid-market SaaS win rate paired with an enterprise cycle length will produce a precise-looking but useless result. Teams building a broader operating view can find sales dashboard examples for ways to structure the reporting layer.
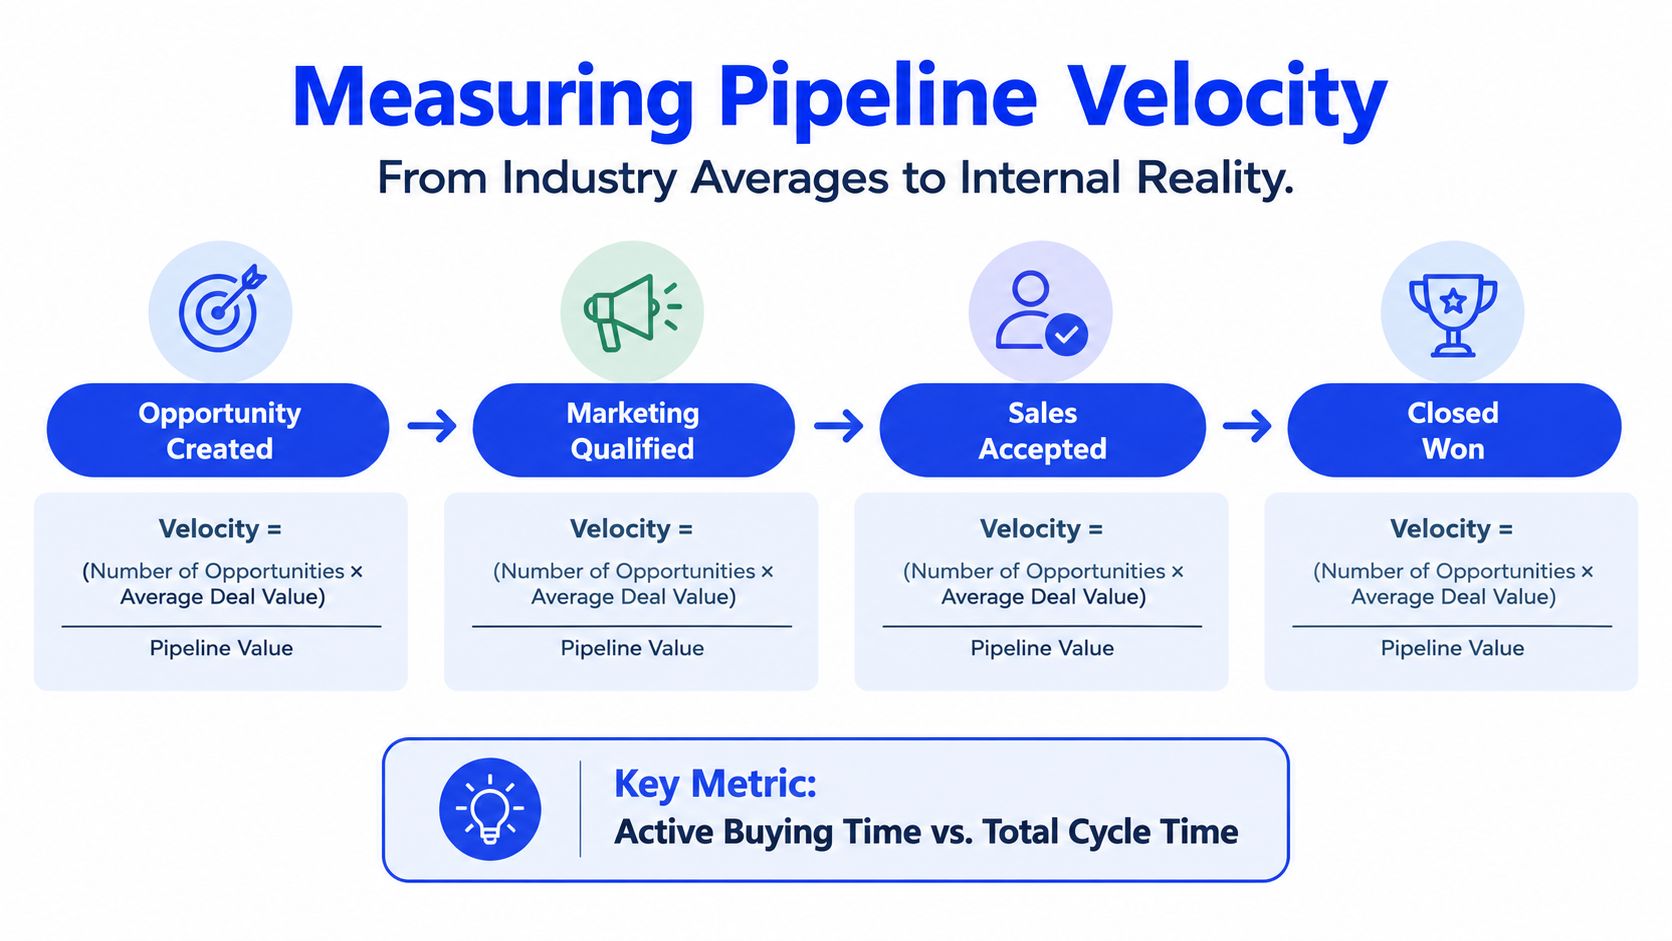
For HubSpot and Salesforce, the useful dashboard isn't the one with the most charts. It's the one that shows a stage conversion drop beside the median age of the affected records. That combination tells a manager whether the problem is qualification quality, rep follow-up, buyer engagement, or an approval step outside the seller's control. Teams reviewing their stack can also use this CRM software comparison when deciding where the workflow should live.
Identifying the bottleneck between reply and meeting
The most common failure in an outbound motion happens after a prospect replies positively and before sales trusts the meeting. More outreach volume won't repair that gap. It can make the calendar noisier while qualified pipeline stays flat.
GROU sees three recurring causes. First, the ICP is too broad, so reps receive meetings with companies that match a superficial firmographic filter but lack the problem, buying trigger, or authority required for progression. Second, positive replies sit in an inbox or shared queue while someone decides who should respond. Third, account executives can't see the original message, account context, or qualification notes early enough to take ownership.
Make qualification a gate, not a suggestion
The handoff should have explicit fit rules. A reply can be positive without being qualified, and a booked meeting can exist without being worth a seller's time. Track those states separately.
A practical workflow is:
Capture: Store the reply, account, contact, sequence, message, and campaign source in the CRM.
Check fit: Apply the agreed industry, company, role, use case, geography, and timing rules.
Route: Assign the reply to a named owner, with a response SLA and fallback owner.
Accept: Mark the lead sales accepted only when the receiving team confirms ownership.
Count quality: Report qualified meetings and meetings held, not only meetings booked.
The response window has a material effect. Firms contacting a prospect within one hour were nearly 7 times more likely to have a qualifying conversation with a decision-maker than firms waiting one additional hour, and more than 60 times more likely than firms waiting 24 hours or longer, according to the speed-to-lead benchmark.
That doesn't mean every reply deserves an immediate calendar link. It means the system should acknowledge interest quickly, preserve context, and move the account to a human owner before the buying signal fades. Your lead-to-meeting conversion framework should therefore separate routing speed from meeting quality.
Use the conversion drop as the diagnosis
A falling booked-to-qualified rate usually points to targeting or qualification rules. A healthy qualification rate with slow meeting acceptance points to routing or seller capacity. A strong accepted-meeting rate with weak opportunity creation suggests the sales conversation, offer, or buying trigger needs review.
In one GROU SaaS program, booked-to-qualified conversion rose from 75% in month 3, or 9 of 12 meetings, to 82% in month 4, or 14 of 17. Those figures are useful because they show the consequence of counting fit, not just activity. The system improved the quality of the handoff rather than pretending every booked meeting represented pipeline.
Systems to compress the front of the cycle
The front of the cycle gets shorter when marketing, outbound, and CRM routing use the same assumptions. A LinkedIn campaign can reveal which role responds, an outbound sequence can test the pain point, and the CRM can preserve the result for the next targeting decision. Run those motions separately and the learning disappears inside channel reports.
Start with evidence from the first campaigns
Don't begin by scaling a large list. Begin with a defined account set, a narrow message, and clear fields for response type, pain signal, role, industry, and disqualification reason. Initial LinkedIn campaigns can show where the ICP is too broad or where urgency is missing.
In the Joan program, 8 LinkedIn campaigns produced 489 conversations and 57 interested leads. That response pattern showed where ICP fit and pain urgency needed tightening before more volume was added. The lesson isn't that every campaign should reproduce those figures. The lesson is that early market data should change the list before the team rewrites the copy repeatedly.
Targeting comes before copy. If the account and buying problem are wrong, a polished sequence only makes the wrong message travel farther.
Connect the resulting account logic to Sales Navigator, Clay, Apollo, or a comparable data workflow. Use Lemlist, Instantly, or Smartlead for sequences where those tools fit the sending and reporting setup. The specific stack matters less than one shared account ID, one source field, and one route into the CRM.
Sequence around buyer attention
Manufacturing buyers often operate around engineering events, trade shows, production planning, and project schedules. Continuous outreach ignores that calendar. When Precision Resource ran across 6 European markets, engineering-buyer responses were shaped by trade-show timing and market saturation, so outreach was sequenced around the event calendar rather than run continuously.
That approach changes the campaign plan. Before an event, publish material that establishes the problem and identify accounts likely to attend or exhibit. During the relevant period, use a focused sequence tied to the operational issue. Afterward, route engagement and conversations into a sales workflow with context from the event.
Unify the reporting line
A connected system needs one target list, one message architecture, and one reporting line across content and outbound. LinkedIn content creates familiarity, outbound creates a direct reason to respond, and CRM fields show whether the account moved from attention to conversation to qualified meeting.
The purpose isn't to automate every human interaction. It's to remove the repeated work between channels, such as rebuilding lists, copying replies, or asking sales which campaign produced a meeting. A workflow for outbound sales automation should include enrichment, deduplication, routing, qualification, and feedback into the next targeting sprint.
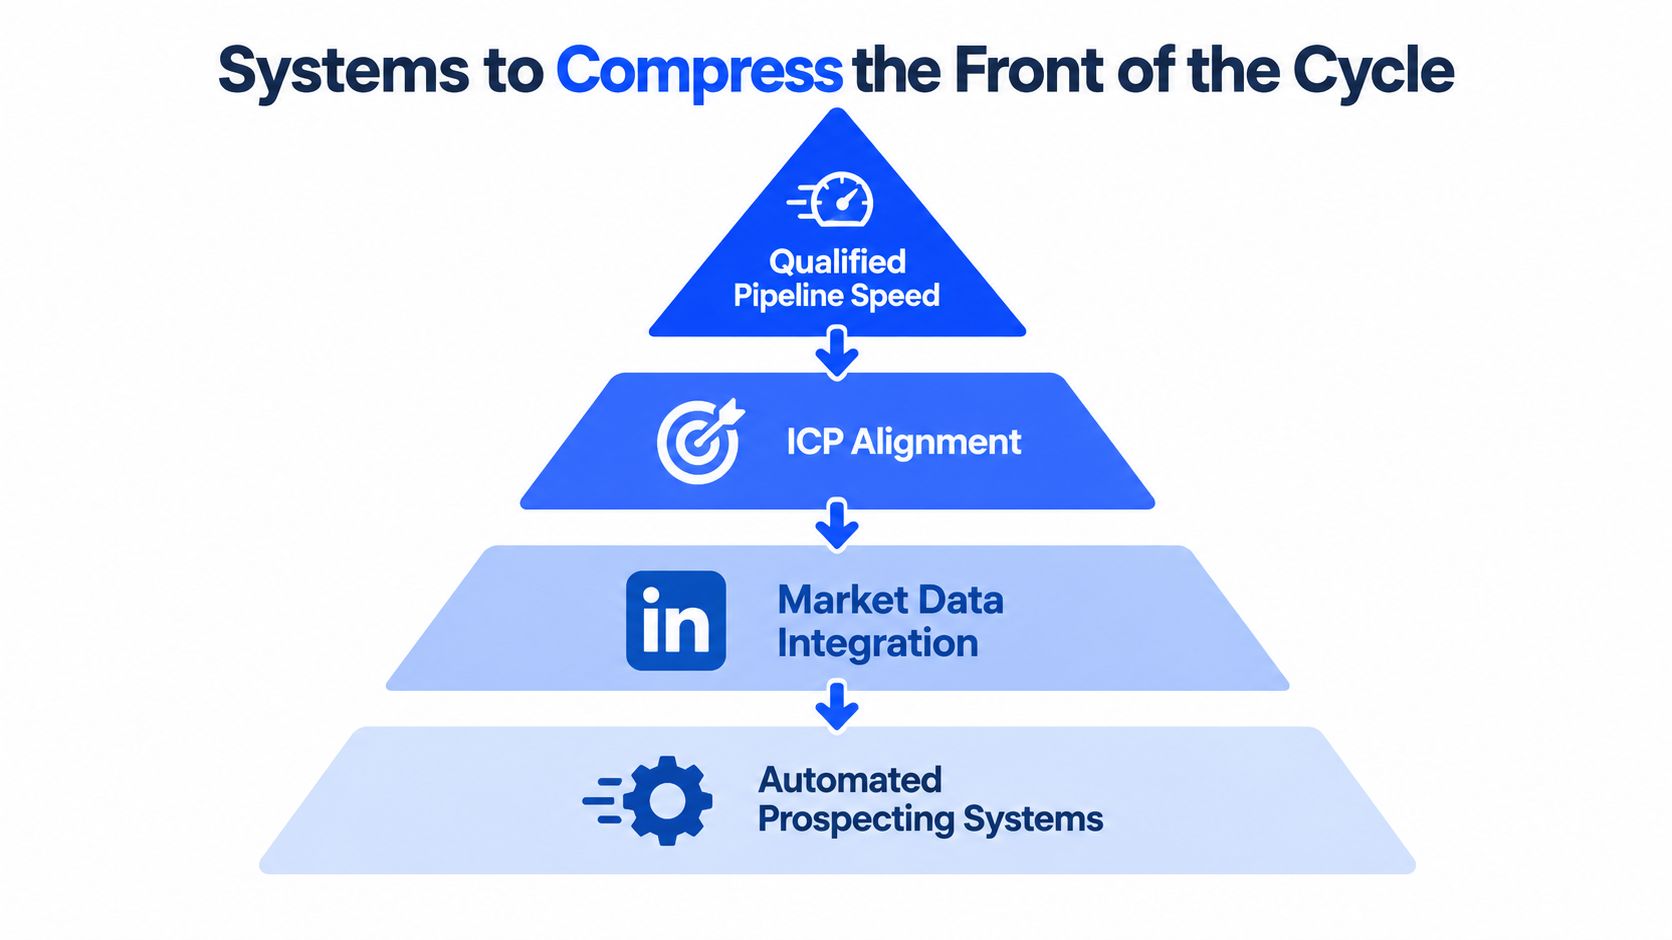
GROU is one example of this operating model. It unifies LinkedIn content, lead generation, and outbound around a shared target list and reporting line. The recommendation is structural: make every channel contribute evidence to the same qualification and routing system.
Pipeline acceleration in practice
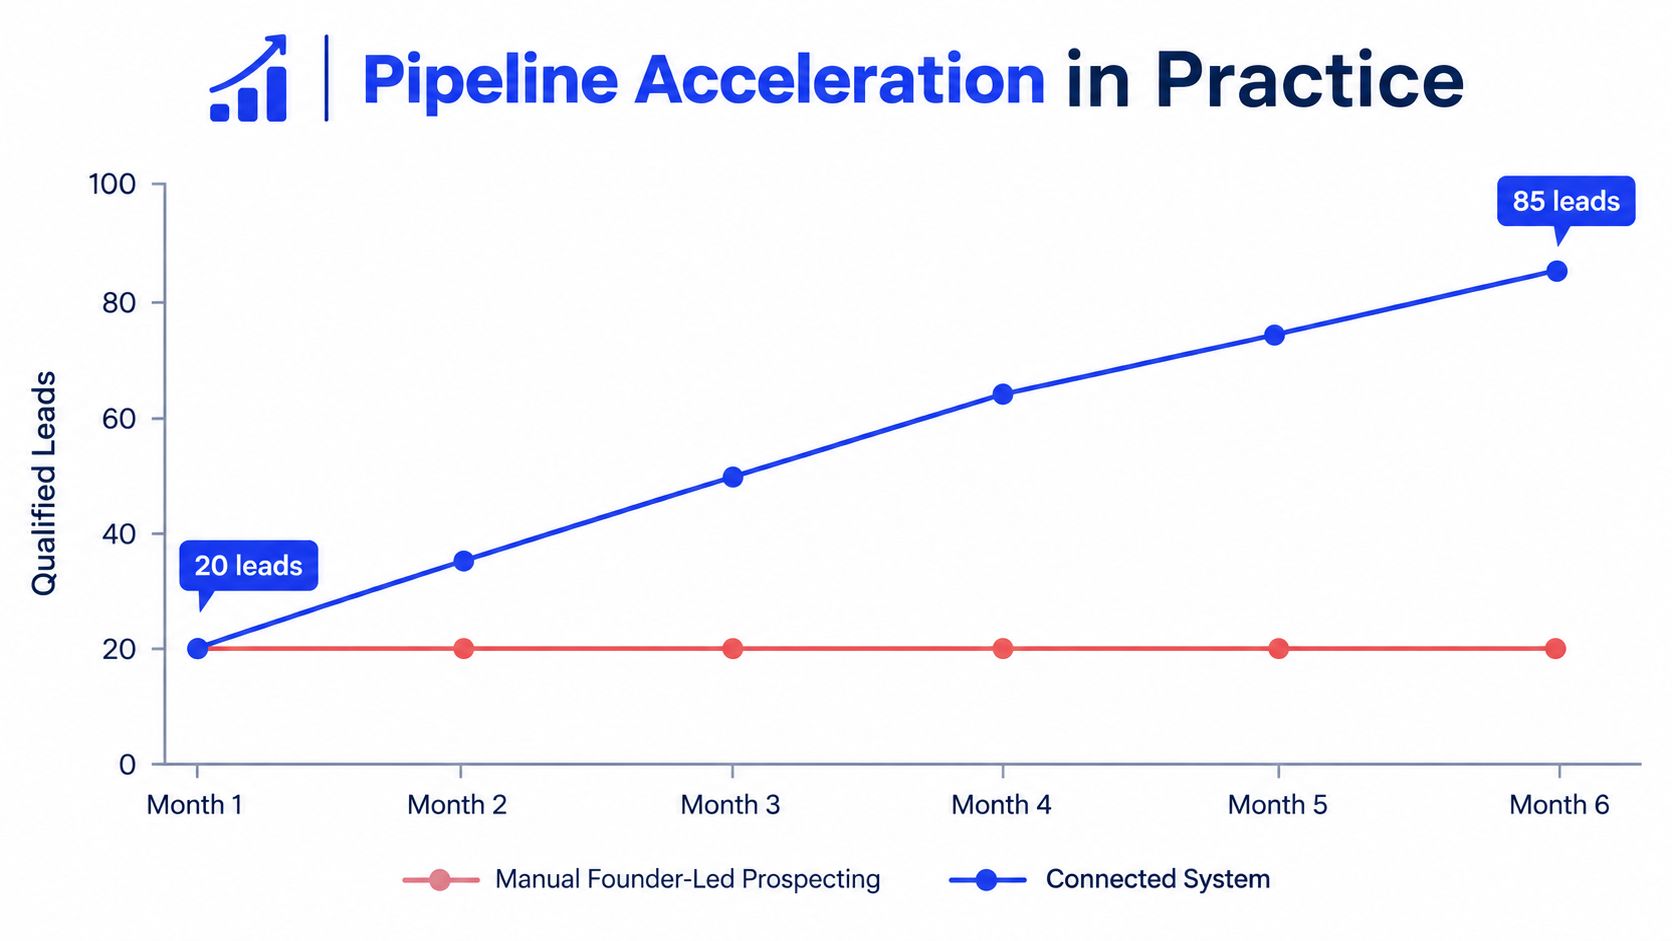
A six-month B2B SaaS program shows why a connected system needs a ramp expectation. Founder-led prospecting produced a baseline of 3 to 4 qualified meetings per month. After replacing that manual motion with one target list, one message, and one reporting line, qualified meetings reached 18 to 22 per month by months 5 and 6, with the lift visible from month 3.
The month-by-month curve matters more than the endpoint. Months 1 and 2 produced 5 to 7 meetings each, month 3 produced 9 qualified meetings, and month 4 produced 14. The first period covered setup, targeting, copy testing, inbox infrastructure, and CRM handoff rules. Judging the program only on its first eight weeks would have confused setup time with market performance.
The manufacturing timeline follows the deal
Manufacturing requires a different expectation. In the Precision Resource program, market saturation and trade-show timing influenced when engineering buyers engaged. The team sequenced activity around those conditions instead of assuming that more daily volume would create faster decisions.
Deal economics also change the acceptable cycle. For Isotrack, a ground protection mat manufacturer, the program produced 30 qualified leads and a closed deal worth more than $20 million. A deal of that scale can justify a longer path through engineering validation, commercial review, and procurement. The goal is not to force it into a SaaS cadence.
The operating question is whether the process makes the next buyer decision easier. Manufacturing teams need event-aware targeting and technical context. SaaS teams may need faster routing, sharper qualification, and more consistent follow-up. Both need the CRM to show which action moved the account forward.
A separate sales process optimization framework can help teams connect those actions to stage movement. The key is to judge the front of the cycle by qualified pipeline created, while judging the full cycle by segment-specific progression and revenue timing.
Don't copy the SaaS ramp into manufacturing, and don't use a large manufacturing deal to excuse weak SaaS routing. The system should adapt to the buying process, while the measurement discipline stays consistent.
Your pipeline audit for this week
Run the audit in your CRM before changing sequence volume or adding another tool. The objective is to find the first internal handoff where time accumulates.
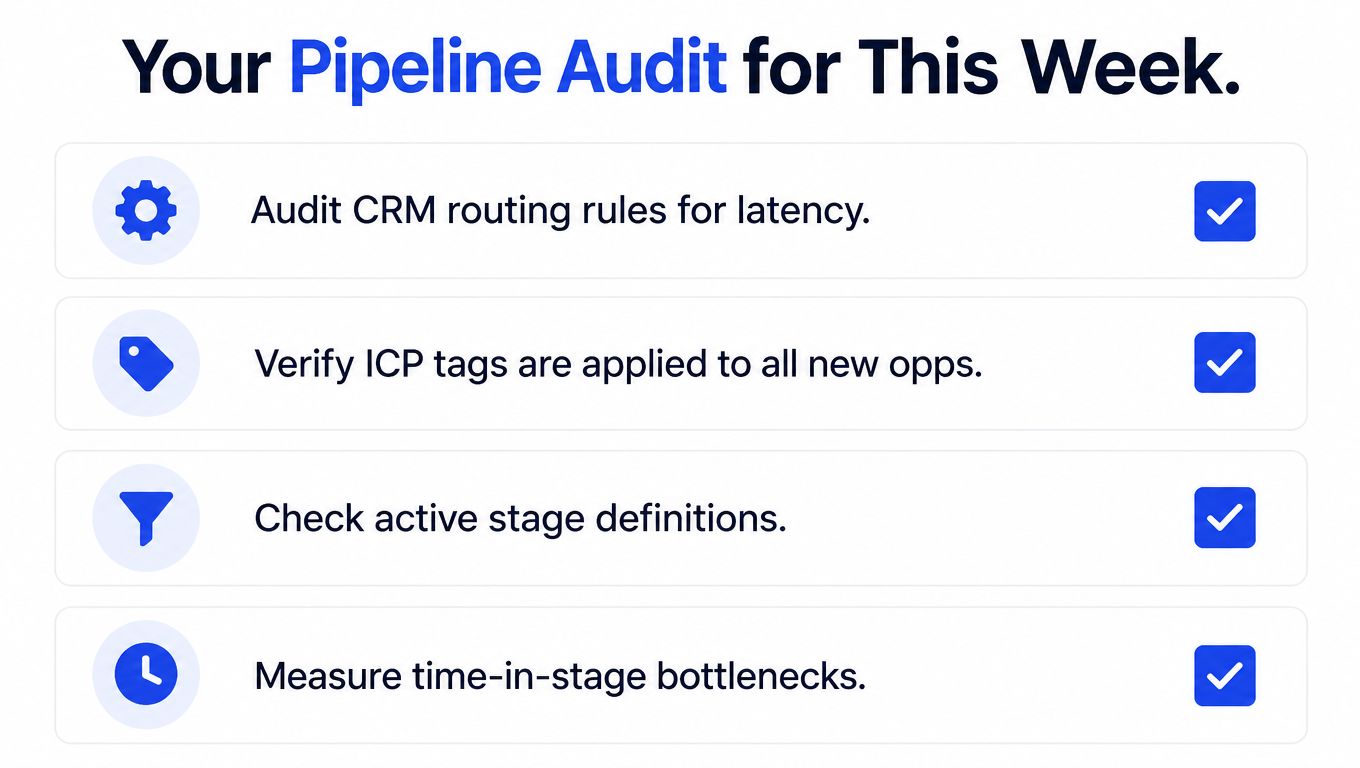
Check meeting-held rate: Compare booked meetings with meetings that happened, then separate qualified from unqualified meetings.
Test speed-to-lead routing: Send a controlled reply through each inbound and outbound path. Confirm the owner, fallback owner, timestamp, and CRM record.
Verify stage definitions: Check that sales accepted lead, SQL, accepted meeting, opportunity, and attributed pipeline mean the same thing to marketing, sales, and RevOps.
Review time in stage: Segment open opportunities by ACV and motion. Flag records with no recent next step, missing decision-maker information, or an age outside the normal range for that segment.
Add a reply received timestamp, sales accepted timestamp, meeting held timestamp, and qualification outcome to every relevant CRM record by Monday. On Friday, review the median time between each pair and identify the largest gap. That gap is the first operational fix, not the average sales cycle length.
GROU is a global B2B pipeline agency that connects LinkedIn content, lead generation, and outbound into one system for qualified conversations and closed revenue. Its bi-weekly sprint method uses daily iteration and shared reporting to produce first signals within 30 days.
Grou helps B2B teams repair the front of the sales cycle through ICP alignment, outbound sequencing, reply routing, and CRM handoffs, rather than adding disconnected activity. Visit Grou to review how that system can fit your SaaS, manufacturing, iGaming, legal tech, or pharma motion, then bring your last 30 opportunities to the first working session.
Deals are sitting in the middle of the funnel while leadership asks for faster closes without adding headcount. The answer usually isn't more activity. It's a cleaner system for routing replies, qualifying fit, and exposing the stage where time is being lost.
→ Benchmark by segment: ACV, buying committee size, and procurement complexity matter more than one blended average.
→ Separate clocks: Total cycle time and active buying time reveal different problems.
→ Fix internal friction: Routing delays, loose ICP rules, and poor CRM visibility often slow the front of the cycle.
→ Forecast from stage data: Shared definitions and time-in-stage reporting produce more useful decisions than headline averages.
Table of Contents
The reality of modern pipeline velocity
B2B sales cycles have stretched. One 2026 benchmark places the median cycle at 84 days across B2B SaaS companies, compared with about 118 days across industries, and reports that cycles have lengthened 22% since 2022. The same benchmark estimates that each additional decision-maker adds 8 to 15 days to the process. See the pipeline velocity framework for the connection between cycle length, deal value, opportunity volume, and win rate.
That movement changes how founders should read a forecast. A pipeline can contain enough nominal coverage and still miss the quarter because every deal now requires more internal agreement, security review, procurement work, or legal input. Sales cycle length is therefore a revenue operations issue, not just a sales manager's coaching metric.
The historical view reinforces the point. One benchmark summary reports an average B2B cycle of 6.5 months in 2025, compared with 4.9 months in 2019, while another places a mid-market median at 92 days in 2026, up from 68 days in 2019. These figures use different methodologies, so they shouldn't be combined into one universal target. They do show a consistent direction.
Practical rule: Treat the published benchmark as a reference range. Treat your own stage history as the operating truth.
Total time hides the actual delay
A deal can spend little time in active evaluation and still take a long time from first touch to signature. Research and qualification may happen before opportunity creation, then procurement and legal may add time after the commercial decision is mostly made. Comparing these periods as one number makes the bottleneck difficult to locate.
Industry pipeline analysis places the blended B2B average at 102 days, with 84 days from lead to opportunity and 18 days from opportunity to close. That split suggests that much of the delay accumulates before formal opportunity creation, rather than during final negotiation. Sales cycle KPIs and tips can help teams map those stages without treating every opportunity as if it followed the same path.
For a founder, the operational question is simple: where does the clock expand? If replies wait for manual review, the issue is routing. If meetings are booked with poor-fit accounts, the issue is qualification. If qualified opportunities sit without a next action, the issue is sales execution or buying-process control.
The rest of the system should answer those questions with evidence. Don't ask reps to “move faster” until the CRM shows which handoff, stage, or approval is responsible for the delay.
Sales cycle length benchmarks by deal size
A universal B2B average is a poor planning tool. A low-value SaaS purchase and a complex manufacturing contract may both appear in the same revenue report, but their buying mechanics are different from the start.
The clearest operational rule is to segment by ACV first, then by buyer group and approval path. One benchmark groups deals under $10,000 into a 2 to 3 month cycle, deals from $10,000 to $100,000 into 3 to 6 months, enterprise deals above $100,000 into 6 to 12 months, and complex enterprise deals above $500,000 into 12 to 18 months. The benchmark is documented in B2B sales benchmarks.
B2B cycle benchmarks by ACV
Deal size (ACV) | Expected cycle length | Primary delay driver |
|---|---|---|
SMB SaaS under $15,000 | 14 to 30 days | Limited approval path and smaller buying group |
Mid-market SaaS from $15,000 to $100,000 | 30 to 90 days | Evaluation, budget approval, and stakeholder alignment |
Enterprise above $100,000 | 90 to 180+ days | Security, procurement, legal, and multi-stakeholder consensus |
Enterprise above $500,000 | 12 to 18 months | Commercial risk, formal approvals, and complex implementation planning |
A separate 2026 SaaS benchmark reports the same broad segment pattern, with 14 to 30 days for SMB deals, 30 to 90 days for mid-market deals, and 90 to 180+ days for enterprise deals. It also links the longer cycle to buying committees growing from 5.4 to 6.8 stakeholders and to deeper security due diligence. Those figures come from a benchmark based on 939 B2B companies.
That stakeholder effect matters more than many teams admit. The 2026 benchmark cited earlier estimates 8 to 15 additional days per decision-maker. A larger committee creates more scheduling work, more requirements, and more opportunities for an internal objection to pause the deal.
Compare like with like
An SMB SaaS deal can close in a few weeks because the buyer may control the budget and the implementation risk is contained. A manufacturing purchase can involve engineering, operations, finance, procurement, and executive approval. The vendor may also need to support customization, prototyping, compliance review, or site-specific planning.
This is why a single average can produce bad coverage assumptions. If your CRM reports one cycle length across iGaming, SaaS, manufacturing, legal tech, and pharma, the result is a blended number that describes none of those motions well.
Use separate benchmarks for → ACV → segment → buying committee size → approval path. Then compare each segment with its own trailing history. A longer cycle isn't automatically a problem. A cycle that exceeds the normal range for its segment, without a documented reason, deserves investigation.
How to measure pipeline velocity in your CRM
Start by fixing the clock. For opportunity-based reporting, define sales cycle length as:
Closed-won date minus opportunity-created date = sales cycle length in days
That measures the selling process after an opportunity enters the active pipeline. It doesn't measure the entire journey from first touch, so store both dates when possible. The first-touch clock helps marketing and outbound teams assess front-end performance. The opportunity clock helps sales and RevOps assess deal progression.
Set the definitions before building the dashboard
Write the definitions in the CRM administration document and make them part of the required field logic.
Sales accepted lead: A lead that meets the agreed fit rules and has been accepted by sales for follow-up.
SQL: A lead that has met the team's qualification threshold and has a documented sales reason to progress.
Accepted meeting: A meeting that took place, involved the intended account or contact, and met the agreed qualification standard.
Attributed pipeline: An opportunity linked to a defined marketing or outbound source, with the attribution model recorded.
Don't change these definitions mid-quarter. If an accepted meeting means “booked” in one month and “held plus qualified” in the next, conversion reporting becomes a labeling exercise.
CRM rule: Every stage needs an entry timestamp, an exit timestamp, an owner, and a reason for disqualification or regression.
In HubSpot, create date properties for first touch, sales acceptance, SQL, meeting held, opportunity creation, and closed won. Use workflows to populate timestamps when lifecycle or deal-stage values change. In Salesforce, use date fields with record-triggered flows, then report on the difference between those fields. Avoid relying only on the current stage, because a current-stage report cannot show how long a deal spent in a previous stage.
Build the stage queries
Your dashboard should answer five questions:
How long does each stage take? Use the median time from stage entry to stage exit, segmented by deal size and motion.
Where do deals stop? Count opportunities with no stage change or next-step update during the team's agreed review window.
How many accepted leads become SQLs? Divide SQLs by sales accepted leads for the same cohort.
How many meetings become opportunities? Divide opportunity creation events by accepted meetings, using the same source and period.
How much sourced pipeline progresses? Group attributed opportunities by source, stage, amount, and age.
The core pipeline velocity formula is:
Velocity = opportunities × average deal value × win rate ÷ sales cycle length
Keep the variables in the same period and segment. A mid-market SaaS win rate paired with an enterprise cycle length will produce a precise-looking but useless result. Teams building a broader operating view can find sales dashboard examples for ways to structure the reporting layer.
For HubSpot and Salesforce, the useful dashboard isn't the one with the most charts. It's the one that shows a stage conversion drop beside the median age of the affected records. That combination tells a manager whether the problem is qualification quality, rep follow-up, buyer engagement, or an approval step outside the seller's control. Teams reviewing their stack can also use this CRM software comparison when deciding where the workflow should live.
Identifying the bottleneck between reply and meeting
The most common failure in an outbound motion happens after a prospect replies positively and before sales trusts the meeting. More outreach volume won't repair that gap. It can make the calendar noisier while qualified pipeline stays flat.
GROU sees three recurring causes. First, the ICP is too broad, so reps receive meetings with companies that match a superficial firmographic filter but lack the problem, buying trigger, or authority required for progression. Second, positive replies sit in an inbox or shared queue while someone decides who should respond. Third, account executives can't see the original message, account context, or qualification notes early enough to take ownership.
Make qualification a gate, not a suggestion
The handoff should have explicit fit rules. A reply can be positive without being qualified, and a booked meeting can exist without being worth a seller's time. Track those states separately.
A practical workflow is:
Capture: Store the reply, account, contact, sequence, message, and campaign source in the CRM.
Check fit: Apply the agreed industry, company, role, use case, geography, and timing rules.
Route: Assign the reply to a named owner, with a response SLA and fallback owner.
Accept: Mark the lead sales accepted only when the receiving team confirms ownership.
Count quality: Report qualified meetings and meetings held, not only meetings booked.
The response window has a material effect. Firms contacting a prospect within one hour were nearly 7 times more likely to have a qualifying conversation with a decision-maker than firms waiting one additional hour, and more than 60 times more likely than firms waiting 24 hours or longer, according to the speed-to-lead benchmark.
That doesn't mean every reply deserves an immediate calendar link. It means the system should acknowledge interest quickly, preserve context, and move the account to a human owner before the buying signal fades. Your lead-to-meeting conversion framework should therefore separate routing speed from meeting quality.
Use the conversion drop as the diagnosis
A falling booked-to-qualified rate usually points to targeting or qualification rules. A healthy qualification rate with slow meeting acceptance points to routing or seller capacity. A strong accepted-meeting rate with weak opportunity creation suggests the sales conversation, offer, or buying trigger needs review.
In one GROU SaaS program, booked-to-qualified conversion rose from 75% in month 3, or 9 of 12 meetings, to 82% in month 4, or 14 of 17. Those figures are useful because they show the consequence of counting fit, not just activity. The system improved the quality of the handoff rather than pretending every booked meeting represented pipeline.
Systems to compress the front of the cycle
The front of the cycle gets shorter when marketing, outbound, and CRM routing use the same assumptions. A LinkedIn campaign can reveal which role responds, an outbound sequence can test the pain point, and the CRM can preserve the result for the next targeting decision. Run those motions separately and the learning disappears inside channel reports.
Start with evidence from the first campaigns
Don't begin by scaling a large list. Begin with a defined account set, a narrow message, and clear fields for response type, pain signal, role, industry, and disqualification reason. Initial LinkedIn campaigns can show where the ICP is too broad or where urgency is missing.
In the Joan program, 8 LinkedIn campaigns produced 489 conversations and 57 interested leads. That response pattern showed where ICP fit and pain urgency needed tightening before more volume was added. The lesson isn't that every campaign should reproduce those figures. The lesson is that early market data should change the list before the team rewrites the copy repeatedly.
Targeting comes before copy. If the account and buying problem are wrong, a polished sequence only makes the wrong message travel farther.
Connect the resulting account logic to Sales Navigator, Clay, Apollo, or a comparable data workflow. Use Lemlist, Instantly, or Smartlead for sequences where those tools fit the sending and reporting setup. The specific stack matters less than one shared account ID, one source field, and one route into the CRM.
Sequence around buyer attention
Manufacturing buyers often operate around engineering events, trade shows, production planning, and project schedules. Continuous outreach ignores that calendar. When Precision Resource ran across 6 European markets, engineering-buyer responses were shaped by trade-show timing and market saturation, so outreach was sequenced around the event calendar rather than run continuously.
That approach changes the campaign plan. Before an event, publish material that establishes the problem and identify accounts likely to attend or exhibit. During the relevant period, use a focused sequence tied to the operational issue. Afterward, route engagement and conversations into a sales workflow with context from the event.
Unify the reporting line
A connected system needs one target list, one message architecture, and one reporting line across content and outbound. LinkedIn content creates familiarity, outbound creates a direct reason to respond, and CRM fields show whether the account moved from attention to conversation to qualified meeting.
The purpose isn't to automate every human interaction. It's to remove the repeated work between channels, such as rebuilding lists, copying replies, or asking sales which campaign produced a meeting. A workflow for outbound sales automation should include enrichment, deduplication, routing, qualification, and feedback into the next targeting sprint.
GROU is one example of this operating model. It unifies LinkedIn content, lead generation, and outbound around a shared target list and reporting line. The recommendation is structural: make every channel contribute evidence to the same qualification and routing system.
Pipeline acceleration in practice
A six-month B2B SaaS program shows why a connected system needs a ramp expectation. Founder-led prospecting produced a baseline of 3 to 4 qualified meetings per month. After replacing that manual motion with one target list, one message, and one reporting line, qualified meetings reached 18 to 22 per month by months 5 and 6, with the lift visible from month 3.
The month-by-month curve matters more than the endpoint. Months 1 and 2 produced 5 to 7 meetings each, month 3 produced 9 qualified meetings, and month 4 produced 14. The first period covered setup, targeting, copy testing, inbox infrastructure, and CRM handoff rules. Judging the program only on its first eight weeks would have confused setup time with market performance.
The manufacturing timeline follows the deal
Manufacturing requires a different expectation. In the Precision Resource program, market saturation and trade-show timing influenced when engineering buyers engaged. The team sequenced activity around those conditions instead of assuming that more daily volume would create faster decisions.
Deal economics also change the acceptable cycle. For Isotrack, a ground protection mat manufacturer, the program produced 30 qualified leads and a closed deal worth more than $20 million. A deal of that scale can justify a longer path through engineering validation, commercial review, and procurement. The goal is not to force it into a SaaS cadence.
The operating question is whether the process makes the next buyer decision easier. Manufacturing teams need event-aware targeting and technical context. SaaS teams may need faster routing, sharper qualification, and more consistent follow-up. Both need the CRM to show which action moved the account forward.
A separate sales process optimization framework can help teams connect those actions to stage movement. The key is to judge the front of the cycle by qualified pipeline created, while judging the full cycle by segment-specific progression and revenue timing.
Don't copy the SaaS ramp into manufacturing, and don't use a large manufacturing deal to excuse weak SaaS routing. The system should adapt to the buying process, while the measurement discipline stays consistent.
Your pipeline audit for this week
Run the audit in your CRM before changing sequence volume or adding another tool. The objective is to find the first internal handoff where time accumulates.
Check meeting-held rate: Compare booked meetings with meetings that happened, then separate qualified from unqualified meetings.
Test speed-to-lead routing: Send a controlled reply through each inbound and outbound path. Confirm the owner, fallback owner, timestamp, and CRM record.
Verify stage definitions: Check that sales accepted lead, SQL, accepted meeting, opportunity, and attributed pipeline mean the same thing to marketing, sales, and RevOps.
Review time in stage: Segment open opportunities by ACV and motion. Flag records with no recent next step, missing decision-maker information, or an age outside the normal range for that segment.
Add a reply received timestamp, sales accepted timestamp, meeting held timestamp, and qualification outcome to every relevant CRM record by Monday. On Friday, review the median time between each pair and identify the largest gap. That gap is the first operational fix, not the average sales cycle length.
GROU is a global B2B pipeline agency that connects LinkedIn content, lead generation, and outbound into one system for qualified conversations and closed revenue. Its bi-weekly sprint method uses daily iteration and shared reporting to produce first signals within 30 days.
Grou helps B2B teams repair the front of the sales cycle through ICP alignment, outbound sequencing, reply routing, and CRM handoffs, rather than adding disconnected activity. Visit Grou to review how that system can fit your SaaS, manufacturing, iGaming, legal tech, or pharma motion, then bring your last 30 opportunities to the first working session.
Deals are sitting in the middle of the funnel while leadership asks for faster closes without adding headcount. The answer usually isn't more activity. It's a cleaner system for routing replies, qualifying fit, and exposing the stage where time is being lost.
→ Benchmark by segment: ACV, buying committee size, and procurement complexity matter more than one blended average.
→ Separate clocks: Total cycle time and active buying time reveal different problems.
→ Fix internal friction: Routing delays, loose ICP rules, and poor CRM visibility often slow the front of the cycle.
→ Forecast from stage data: Shared definitions and time-in-stage reporting produce more useful decisions than headline averages.
Table of Contents
The reality of modern pipeline velocity
B2B sales cycles have stretched. One 2026 benchmark places the median cycle at 84 days across B2B SaaS companies, compared with about 118 days across industries, and reports that cycles have lengthened 22% since 2022. The same benchmark estimates that each additional decision-maker adds 8 to 15 days to the process. See the pipeline velocity framework for the connection between cycle length, deal value, opportunity volume, and win rate.
That movement changes how founders should read a forecast. A pipeline can contain enough nominal coverage and still miss the quarter because every deal now requires more internal agreement, security review, procurement work, or legal input. Sales cycle length is therefore a revenue operations issue, not just a sales manager's coaching metric.
The historical view reinforces the point. One benchmark summary reports an average B2B cycle of 6.5 months in 2025, compared with 4.9 months in 2019, while another places a mid-market median at 92 days in 2026, up from 68 days in 2019. These figures use different methodologies, so they shouldn't be combined into one universal target. They do show a consistent direction.
Practical rule: Treat the published benchmark as a reference range. Treat your own stage history as the operating truth.
Total time hides the actual delay
A deal can spend little time in active evaluation and still take a long time from first touch to signature. Research and qualification may happen before opportunity creation, then procurement and legal may add time after the commercial decision is mostly made. Comparing these periods as one number makes the bottleneck difficult to locate.
Industry pipeline analysis places the blended B2B average at 102 days, with 84 days from lead to opportunity and 18 days from opportunity to close. That split suggests that much of the delay accumulates before formal opportunity creation, rather than during final negotiation. Sales cycle KPIs and tips can help teams map those stages without treating every opportunity as if it followed the same path.
For a founder, the operational question is simple: where does the clock expand? If replies wait for manual review, the issue is routing. If meetings are booked with poor-fit accounts, the issue is qualification. If qualified opportunities sit without a next action, the issue is sales execution or buying-process control.
The rest of the system should answer those questions with evidence. Don't ask reps to “move faster” until the CRM shows which handoff, stage, or approval is responsible for the delay.
Sales cycle length benchmarks by deal size
A universal B2B average is a poor planning tool. A low-value SaaS purchase and a complex manufacturing contract may both appear in the same revenue report, but their buying mechanics are different from the start.
The clearest operational rule is to segment by ACV first, then by buyer group and approval path. One benchmark groups deals under $10,000 into a 2 to 3 month cycle, deals from $10,000 to $100,000 into 3 to 6 months, enterprise deals above $100,000 into 6 to 12 months, and complex enterprise deals above $500,000 into 12 to 18 months. The benchmark is documented in B2B sales benchmarks.
B2B cycle benchmarks by ACV
Deal size (ACV) | Expected cycle length | Primary delay driver |
|---|---|---|
SMB SaaS under $15,000 | 14 to 30 days | Limited approval path and smaller buying group |
Mid-market SaaS from $15,000 to $100,000 | 30 to 90 days | Evaluation, budget approval, and stakeholder alignment |
Enterprise above $100,000 | 90 to 180+ days | Security, procurement, legal, and multi-stakeholder consensus |
Enterprise above $500,000 | 12 to 18 months | Commercial risk, formal approvals, and complex implementation planning |
A separate 2026 SaaS benchmark reports the same broad segment pattern, with 14 to 30 days for SMB deals, 30 to 90 days for mid-market deals, and 90 to 180+ days for enterprise deals. It also links the longer cycle to buying committees growing from 5.4 to 6.8 stakeholders and to deeper security due diligence. Those figures come from a benchmark based on 939 B2B companies.
That stakeholder effect matters more than many teams admit. The 2026 benchmark cited earlier estimates 8 to 15 additional days per decision-maker. A larger committee creates more scheduling work, more requirements, and more opportunities for an internal objection to pause the deal.
Compare like with like
An SMB SaaS deal can close in a few weeks because the buyer may control the budget and the implementation risk is contained. A manufacturing purchase can involve engineering, operations, finance, procurement, and executive approval. The vendor may also need to support customization, prototyping, compliance review, or site-specific planning.
This is why a single average can produce bad coverage assumptions. If your CRM reports one cycle length across iGaming, SaaS, manufacturing, legal tech, and pharma, the result is a blended number that describes none of those motions well.
Use separate benchmarks for → ACV → segment → buying committee size → approval path. Then compare each segment with its own trailing history. A longer cycle isn't automatically a problem. A cycle that exceeds the normal range for its segment, without a documented reason, deserves investigation.
How to measure pipeline velocity in your CRM
Start by fixing the clock. For opportunity-based reporting, define sales cycle length as:
Closed-won date minus opportunity-created date = sales cycle length in days
That measures the selling process after an opportunity enters the active pipeline. It doesn't measure the entire journey from first touch, so store both dates when possible. The first-touch clock helps marketing and outbound teams assess front-end performance. The opportunity clock helps sales and RevOps assess deal progression.
Set the definitions before building the dashboard
Write the definitions in the CRM administration document and make them part of the required field logic.
Sales accepted lead: A lead that meets the agreed fit rules and has been accepted by sales for follow-up.
SQL: A lead that has met the team's qualification threshold and has a documented sales reason to progress.
Accepted meeting: A meeting that took place, involved the intended account or contact, and met the agreed qualification standard.
Attributed pipeline: An opportunity linked to a defined marketing or outbound source, with the attribution model recorded.
Don't change these definitions mid-quarter. If an accepted meeting means “booked” in one month and “held plus qualified” in the next, conversion reporting becomes a labeling exercise.
CRM rule: Every stage needs an entry timestamp, an exit timestamp, an owner, and a reason for disqualification or regression.
In HubSpot, create date properties for first touch, sales acceptance, SQL, meeting held, opportunity creation, and closed won. Use workflows to populate timestamps when lifecycle or deal-stage values change. In Salesforce, use date fields with record-triggered flows, then report on the difference between those fields. Avoid relying only on the current stage, because a current-stage report cannot show how long a deal spent in a previous stage.
Build the stage queries
Your dashboard should answer five questions:
How long does each stage take? Use the median time from stage entry to stage exit, segmented by deal size and motion.
Where do deals stop? Count opportunities with no stage change or next-step update during the team's agreed review window.
How many accepted leads become SQLs? Divide SQLs by sales accepted leads for the same cohort.
How many meetings become opportunities? Divide opportunity creation events by accepted meetings, using the same source and period.
How much sourced pipeline progresses? Group attributed opportunities by source, stage, amount, and age.
The core pipeline velocity formula is:
Velocity = opportunities × average deal value × win rate ÷ sales cycle length
Keep the variables in the same period and segment. A mid-market SaaS win rate paired with an enterprise cycle length will produce a precise-looking but useless result. Teams building a broader operating view can find sales dashboard examples for ways to structure the reporting layer.
For HubSpot and Salesforce, the useful dashboard isn't the one with the most charts. It's the one that shows a stage conversion drop beside the median age of the affected records. That combination tells a manager whether the problem is qualification quality, rep follow-up, buyer engagement, or an approval step outside the seller's control. Teams reviewing their stack can also use this CRM software comparison when deciding where the workflow should live.
Identifying the bottleneck between reply and meeting
The most common failure in an outbound motion happens after a prospect replies positively and before sales trusts the meeting. More outreach volume won't repair that gap. It can make the calendar noisier while qualified pipeline stays flat.
GROU sees three recurring causes. First, the ICP is too broad, so reps receive meetings with companies that match a superficial firmographic filter but lack the problem, buying trigger, or authority required for progression. Second, positive replies sit in an inbox or shared queue while someone decides who should respond. Third, account executives can't see the original message, account context, or qualification notes early enough to take ownership.
Make qualification a gate, not a suggestion
The handoff should have explicit fit rules. A reply can be positive without being qualified, and a booked meeting can exist without being worth a seller's time. Track those states separately.
A practical workflow is:
Capture: Store the reply, account, contact, sequence, message, and campaign source in the CRM.
Check fit: Apply the agreed industry, company, role, use case, geography, and timing rules.
Route: Assign the reply to a named owner, with a response SLA and fallback owner.
Accept: Mark the lead sales accepted only when the receiving team confirms ownership.
Count quality: Report qualified meetings and meetings held, not only meetings booked.
The response window has a material effect. Firms contacting a prospect within one hour were nearly 7 times more likely to have a qualifying conversation with a decision-maker than firms waiting one additional hour, and more than 60 times more likely than firms waiting 24 hours or longer, according to the speed-to-lead benchmark.
That doesn't mean every reply deserves an immediate calendar link. It means the system should acknowledge interest quickly, preserve context, and move the account to a human owner before the buying signal fades. Your lead-to-meeting conversion framework should therefore separate routing speed from meeting quality.
Use the conversion drop as the diagnosis
A falling booked-to-qualified rate usually points to targeting or qualification rules. A healthy qualification rate with slow meeting acceptance points to routing or seller capacity. A strong accepted-meeting rate with weak opportunity creation suggests the sales conversation, offer, or buying trigger needs review.
In one GROU SaaS program, booked-to-qualified conversion rose from 75% in month 3, or 9 of 12 meetings, to 82% in month 4, or 14 of 17. Those figures are useful because they show the consequence of counting fit, not just activity. The system improved the quality of the handoff rather than pretending every booked meeting represented pipeline.
Systems to compress the front of the cycle
The front of the cycle gets shorter when marketing, outbound, and CRM routing use the same assumptions. A LinkedIn campaign can reveal which role responds, an outbound sequence can test the pain point, and the CRM can preserve the result for the next targeting decision. Run those motions separately and the learning disappears inside channel reports.
Start with evidence from the first campaigns
Don't begin by scaling a large list. Begin with a defined account set, a narrow message, and clear fields for response type, pain signal, role, industry, and disqualification reason. Initial LinkedIn campaigns can show where the ICP is too broad or where urgency is missing.
In the Joan program, 8 LinkedIn campaigns produced 489 conversations and 57 interested leads. That response pattern showed where ICP fit and pain urgency needed tightening before more volume was added. The lesson isn't that every campaign should reproduce those figures. The lesson is that early market data should change the list before the team rewrites the copy repeatedly.
Targeting comes before copy. If the account and buying problem are wrong, a polished sequence only makes the wrong message travel farther.
Connect the resulting account logic to Sales Navigator, Clay, Apollo, or a comparable data workflow. Use Lemlist, Instantly, or Smartlead for sequences where those tools fit the sending and reporting setup. The specific stack matters less than one shared account ID, one source field, and one route into the CRM.
Sequence around buyer attention
Manufacturing buyers often operate around engineering events, trade shows, production planning, and project schedules. Continuous outreach ignores that calendar. When Precision Resource ran across 6 European markets, engineering-buyer responses were shaped by trade-show timing and market saturation, so outreach was sequenced around the event calendar rather than run continuously.
That approach changes the campaign plan. Before an event, publish material that establishes the problem and identify accounts likely to attend or exhibit. During the relevant period, use a focused sequence tied to the operational issue. Afterward, route engagement and conversations into a sales workflow with context from the event.
Unify the reporting line
A connected system needs one target list, one message architecture, and one reporting line across content and outbound. LinkedIn content creates familiarity, outbound creates a direct reason to respond, and CRM fields show whether the account moved from attention to conversation to qualified meeting.
The purpose isn't to automate every human interaction. It's to remove the repeated work between channels, such as rebuilding lists, copying replies, or asking sales which campaign produced a meeting. A workflow for outbound sales automation should include enrichment, deduplication, routing, qualification, and feedback into the next targeting sprint.
GROU is one example of this operating model. It unifies LinkedIn content, lead generation, and outbound around a shared target list and reporting line. The recommendation is structural: make every channel contribute evidence to the same qualification and routing system.
Pipeline acceleration in practice
A six-month B2B SaaS program shows why a connected system needs a ramp expectation. Founder-led prospecting produced a baseline of 3 to 4 qualified meetings per month. After replacing that manual motion with one target list, one message, and one reporting line, qualified meetings reached 18 to 22 per month by months 5 and 6, with the lift visible from month 3.
The month-by-month curve matters more than the endpoint. Months 1 and 2 produced 5 to 7 meetings each, month 3 produced 9 qualified meetings, and month 4 produced 14. The first period covered setup, targeting, copy testing, inbox infrastructure, and CRM handoff rules. Judging the program only on its first eight weeks would have confused setup time with market performance.
The manufacturing timeline follows the deal
Manufacturing requires a different expectation. In the Precision Resource program, market saturation and trade-show timing influenced when engineering buyers engaged. The team sequenced activity around those conditions instead of assuming that more daily volume would create faster decisions.
Deal economics also change the acceptable cycle. For Isotrack, a ground protection mat manufacturer, the program produced 30 qualified leads and a closed deal worth more than $20 million. A deal of that scale can justify a longer path through engineering validation, commercial review, and procurement. The goal is not to force it into a SaaS cadence.
The operating question is whether the process makes the next buyer decision easier. Manufacturing teams need event-aware targeting and technical context. SaaS teams may need faster routing, sharper qualification, and more consistent follow-up. Both need the CRM to show which action moved the account forward.
A separate sales process optimization framework can help teams connect those actions to stage movement. The key is to judge the front of the cycle by qualified pipeline created, while judging the full cycle by segment-specific progression and revenue timing.
Don't copy the SaaS ramp into manufacturing, and don't use a large manufacturing deal to excuse weak SaaS routing. The system should adapt to the buying process, while the measurement discipline stays consistent.
Your pipeline audit for this week
Run the audit in your CRM before changing sequence volume or adding another tool. The objective is to find the first internal handoff where time accumulates.
Check meeting-held rate: Compare booked meetings with meetings that happened, then separate qualified from unqualified meetings.
Test speed-to-lead routing: Send a controlled reply through each inbound and outbound path. Confirm the owner, fallback owner, timestamp, and CRM record.
Verify stage definitions: Check that sales accepted lead, SQL, accepted meeting, opportunity, and attributed pipeline mean the same thing to marketing, sales, and RevOps.
Review time in stage: Segment open opportunities by ACV and motion. Flag records with no recent next step, missing decision-maker information, or an age outside the normal range for that segment.
Add a reply received timestamp, sales accepted timestamp, meeting held timestamp, and qualification outcome to every relevant CRM record by Monday. On Friday, review the median time between each pair and identify the largest gap. That gap is the first operational fix, not the average sales cycle length.
GROU is a global B2B pipeline agency that connects LinkedIn content, lead generation, and outbound into one system for qualified conversations and closed revenue. Its bi-weekly sprint method uses daily iteration and shared reporting to produce first signals within 30 days.
Grou helps B2B teams repair the front of the sales cycle through ICP alignment, outbound sequencing, reply routing, and CRM handoffs, rather than adding disconnected activity. Visit Grou to review how that system can fit your SaaS, manufacturing, iGaming, legal tech, or pharma motion, then bring your last 30 opportunities to the first working session.
Pipeline OS Newsletter
Build qualified pipeline
Get weekly tactics to generate demand, improve lead quality, and book more meetings.





Trusted by industry leaders
Trusted by industry leaders
Trusted by industry leaders
Ready to build qualified pipeline?
Ready to build qualified pipeline?
Ready to build qualified pipeline?
Book a call to see if we're the right fit, or take the 2-minute quiz to get a clear starting point.
Book a call to see if we're the right fit, or take the 2-minute quiz to get a clear starting point.
Book a call to see if we're the right fit, or take the 2-minute quiz to get a clear starting point.
" height="30.21639343089746px" id="hfGbXmQR2" width="30.216393430897455px"/></svg>)
Copyright © 2026 – All Right Reserved
Copyright © 2026 – All Right Reserved
Copyright © 2026 – All Right Reserved