%22%3E%3C/path%3E%3Cpath d=%22M 63.072 7.554 C 62.258 8.022 61.577 8.689 61.092 9.493 L 61.092 7.076 L 57.158 7.076 L 57.158 22.64 L 61.089 22.64 L 61.089 14.888 C 61.089 13.446 61.403 12.434 62.03 11.853 C 62.818 11.218 63.818 10.907 64.826 10.982 L 65.868 10.982 L 65.868 6.851 C 64.891 6.834 63.926 7.076 63.073 7.554 Z%22 fill=%22rgb(17,17,17)%22%3E%3C/path%3E%3Cpath d=%22M 78.916 7.82 C 76.363 6.49 73.321 6.49 70.768 7.82 C 69.562 8.473 68.564 9.451 67.888 10.644 C 67.167 11.931 66.803 13.387 66.834 14.862 C 66.804 16.332 67.157 17.785 67.86 19.077 C 68.515 20.267 69.494 21.246 70.684 21.901 C 71.924 22.576 73.318 22.92 74.73 22.898 C 76.164 22.918 77.58 22.575 78.846 21.901 C 80.062 21.247 81.073 20.27 81.768 19.077 C 82.506 17.797 82.88 16.339 82.85 14.862 C 82.88 13.389 82.517 11.934 81.797 10.647 C 81.12 9.455 80.122 8.477 78.917 7.824 M 78.803 14.862 C 78.829 15.739 78.636 16.608 78.241 17.391 C 77.903 18.046 77.38 18.588 76.738 18.95 C 76.124 19.293 75.432 19.472 74.729 19.47 C 73.668 19.497 72.648 19.061 71.934 18.276 C 71.139 17.323 70.741 16.1 70.823 14.862 C 70.741 13.62 71.149 12.395 71.959 11.45 C 72.687 10.667 73.715 10.233 74.783 10.256 C 75.859 10.236 76.894 10.67 77.635 11.45 C 78.464 12.387 78.884 13.616 78.801 14.864%22 fill=%22rgb(17,17,17)%22%3E%3C/path%3E%3Cpath d=%22M 95.906 7.076 L 95.906 15.646 C 95.975 16.68 95.643 17.701 94.979 18.498 C 94.311 19.184 93.379 19.547 92.422 19.495 C 91.475 19.544 90.553 19.18 89.894 18.498 C 89.23 17.701 88.898 16.68 88.967 15.646 L 88.967 7.076 L 85.033 7.076 L 85.033 16.207 C 85 17.449 85.275 18.68 85.834 19.79 C 86.327 20.75 87.095 21.542 88.039 22.065 C 89.033 22.594 90.145 22.861 91.271 22.838 C 92.188 22.847 93.095 22.65 93.926 22.263 C 94.708 21.905 95.388 21.36 95.906 20.675 L 95.906 22.645 L 99.865 22.645 L 99.865 7.076 Z%22 fill=%22rgb(17,17,17)%22%3E%3C/path%3E%3Cpath d=%22M 4.513 15.626 C 4.511 10.815 7.606 6.549 12.181 5.059 C 16.756 3.57 21.77 5.195 24.601 9.086 L 27.816 5.87 C 24.074 1.186 17.981 -0.943 12.137 0.393 C 6.292 1.728 1.728 6.292 0.393 12.137 C -0.943 17.981 1.186 24.074 5.87 27.816 L 9.085 24.601 C 6.214 22.512 4.515 19.177 4.513 15.626%22 fill=%22rgb(32,62,235)%22%3E%3C/path%3E%3Cpath d=%22M 17.114 14.343 L 13.354 18.01 L 13.354 18.026 L 21.071 18.026 L 11.412 27.609 L 17.389 27.609 L 23.999 21.081 L 23.999 28.316 L 24.005 28.316 L 27.967 24.393 L 27.967 14.343 Z%22 fill=%22rgb(32,62,235)%22%3E%3C/path%3E%3C/g%3E%3C/svg%3E) ×
× ××
××›
›
›
›
KPIs for lead generation in 2026: what to track, what to ignore, and why
KPIs for lead generation in 2026: what to track, what to ignore, and why
KPIs for lead generation in 2026: what to track, what to ignore, and why
KPIs for lead generation in 2026: what to track, what to ignore, and why
KPIs for lead generation in 2026: what to track, what to ignore, and why
KPIs for lead generation in 2026: what to track, what to ignore, and why

Author
Aljaz Peklaj

Your lead generation dashboard is a liar. You're staring at charts for opens, clicks, meeting volume, and MQLs. The graphs look healthy, but revenue feels flat. The numbers show activity, not whether the system is producing pipeline.
Structure turns attention into pipeline. That means tracking the few metrics that predict revenue, not the dozens that measure motion. Clean reporting also depends on basics like data quality governance, because bad stage data makes even a polished dashboard useless.
The three leading indicators that predict funnel success in the first 90 days
Actionable thresholds that tell you when to scale and when to stop
Industry-specific benchmarks for iGaming, SaaS, manufacturing, and legal tech
A system for connecting leading indicators to lagging revenue milestones
Table of Contents
1. Reply rate on outbound touches
If I'm assessing a new funnel, this is the first number I check. Not opens. Not clicks. Not meetings booked. Reply rate tells you whether the audience, message, and timing are working at all.
For B2B lead generation engagement, top-performing campaigns hit 20 to 30% engagement on email and social content, and that level is tied to stronger MQL conversion according to Martal's lead generation KPI benchmarks. In outbound, the tighter operating threshold I use is simpler. Under 4% is broken, 4 to 8% is functional, 8 to 12% is working, 12%+ is strong.

Why this is the first KPI
You need enough replies before any downstream metric means much. If a sequence in Apollo or Smartlead can't generate responses, there's nothing worth scaling in HubSpot later. That's why reply rate is the foundation KPI in most outbound systems, especially for teams running cold email programs.
Manufacturing is where this becomes obvious fast. In that market, email-first outreach often lags, while phone-led campaigns have produced connect-to-meeting rates of 11 to 16%. That changed channel strategy entirely for several teams we've seen. The lesson wasn't “write better emails.” It was “stop forcing a SaaS motion onto a manufacturing buyer.”
Practical rule: Don't judge reply rate in the first few days. Judge it after enough volume and after the sequence has had time to run.
What to do when reply rate is weak
Teams often edit copy too early. The actual fix is usually upstream.
Check ICP definition: If reply rate is below 4% for 21+ days with enough weekly volume, the list or offer is usually wrong.
Split by channel: Email, LinkedIn through HeyReach, and phone should never be blended into one response metric.
Separate real replies: Auto-responses, referrals, and out-of-office replies inflate the view if you don't tag them.
Review intent tiers: High-intent leads need a lead response time under 5 minutes, while lower-intent leads can tolerate up to 24 hours, as noted in MarketBetter's KPI guidance.
For teams tracking kpis for lead generation, this is the first signal that tells the truth quickly. If it's weak, pause scale and rebuild the list, the message, or both.
2. Cost per qualified meeting
A team can book 30 meetings in a month and still miss pipeline. I have seen that happen when paid media, SDR time, and data costs were optimized for calendar volume instead of buyer fit. Cost per qualified meeting is one of the three KPIs I check first because it shows whether spend is producing sales-usable conversations, not activity.
The working formula is simple:
CPQM = total lead generation spend ÷ number of meetings that meet your qualification standard
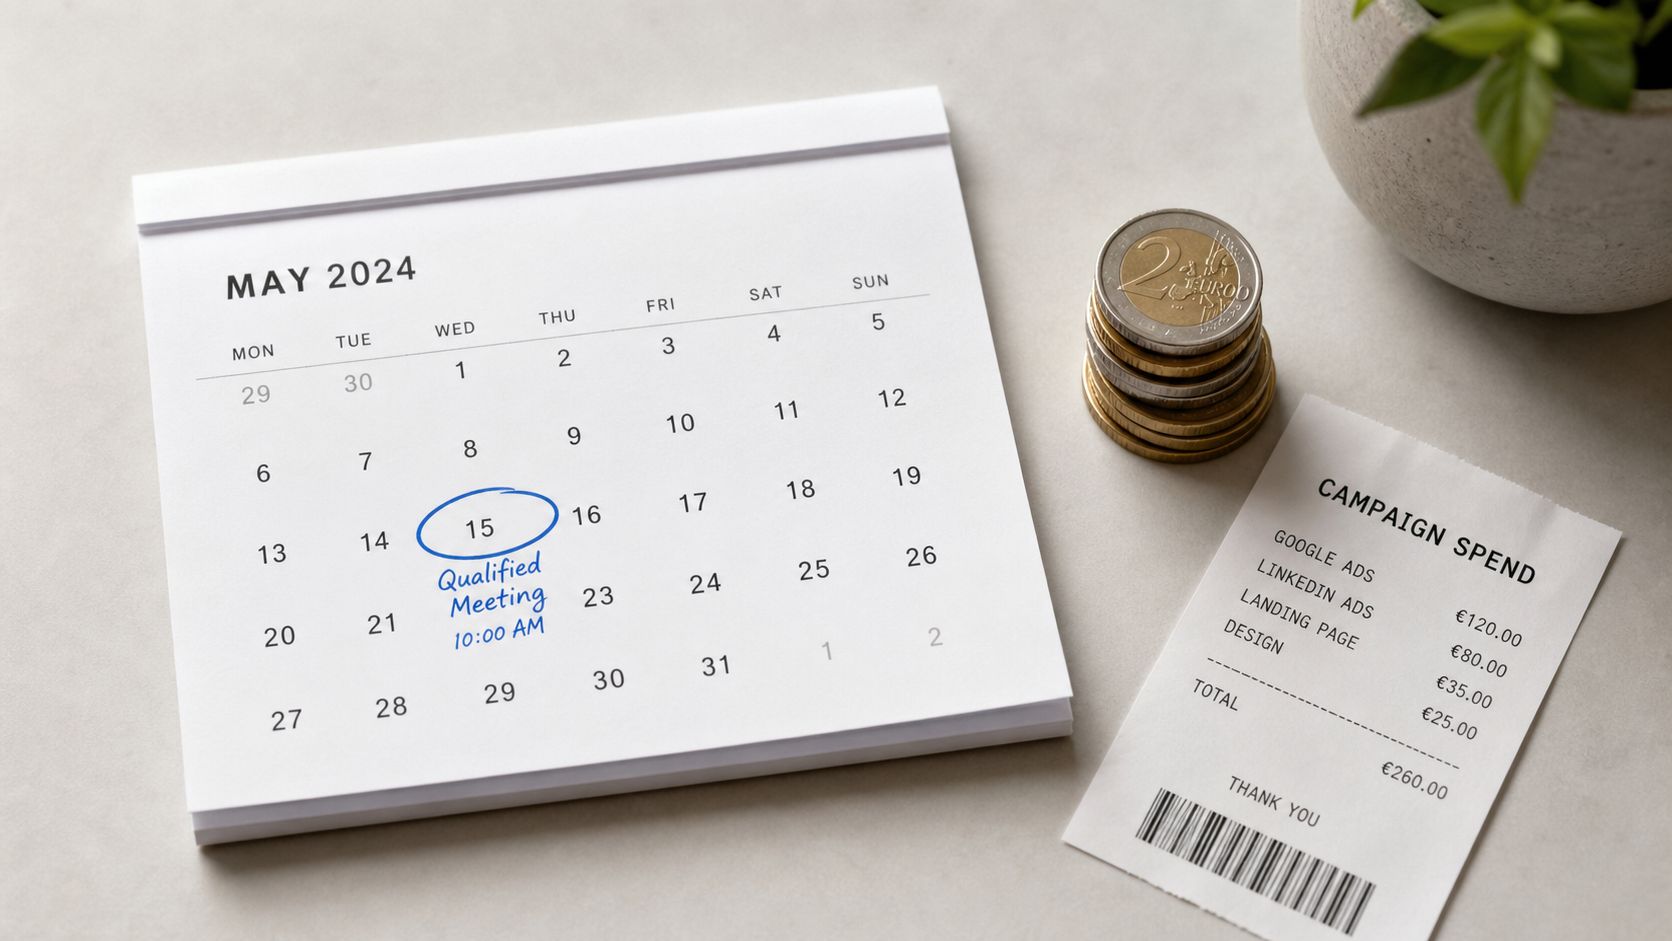
For most B2B teams, I use these bands as an operating guide. Under €400 is strong. €400 to €700 is workable. €700 to €1,200 needs investigation. Above €1,200 only makes sense if deal size, margin, and close rate support it.
What belongs in the calculation
Count the full acquisition cost. That means list build, enrichment tools like Apollo or Clay, outbound platforms, paid channel spend, SDR or agency labor, and sales time if your reps are doing first-touch qualification. If labor is missing, CPQM looks better on paper than it is in the budget.
The other half is the definition of “qualified.” Keep it tight. A booked intro is not enough. In HubSpot or Salesforce, I want a meeting marked qualified only after it matches the ICP, has a live need, and clears the bar defined in your lead qualification process for sales handoff. If you already use an appointment setting system, tie that output to the same rule set or the metric will drift.
Benchmarks by market
The useful benchmark is not one global average. It is the cost range your market can absorb.
SaaS: Lower-friction categories can often tolerate a lower CPQM because volume is higher and outreach is easier to automate.
Manufacturing: CPQM is often higher, especially when phone, trade list data, and rep research do more of the work.
iGaming: Costs rise fast when compliance limits targeting options and only a narrow segment of accounts can buy.
That is why CPQM belongs near reply rate and qualification rate in the first 90 days. Reply rate shows whether the market will engage. CPQM shows what that engagement costs to turn into a real sales conversation.
Where teams get this wrong
High CPQM usually starts upstream.
Targeting is too broad: Extra meetings from weak-fit accounts push cost up because they consume paid spend and rep time without becoming pipeline.
Channel mix is blended: LinkedIn, cold email, paid search, and phone produce very different economics. Track CPQM by source.
Qualification rules are soft: If one SDR marks any positive call as qualified, CPQM looks lower until sales rejects the meetings later.
Reviews happen too slowly: Use a rolling 30-day view and a source-level view. Monthly totals hide channel problems.
One more practical rule. Do not try to fix a high CPQM by editing one email step first. Start with account selection, source mix, and qualification criteria. Those three usually move the number faster than copy changes.
For teams serious about kpis for lead generation, CPQM is the spend discipline metric. If reply rate is healthy but CPQM is still high, the system is paying too much for fit.
3. Qualification rate after first meeting
This is the KPI most often hidden behind glossy reporting. Agencies love booked meetings because booked meetings are easy to count. Operators care about what happens after the first call.
If fewer than 40% of held meetings progress to opportunity, the funnel has a qualification problem. A 40 to 60% rate needs work. A 60 to 75% rate is strong. Above that is rare enough that I want to inspect the definitions before celebrating.
The threshold that matters
For small to mid-sized B2B teams, 200 to 500 leads per month is considered a solid benchmark, while SQL-to-deal conversion ideally lands in the 20 to 30% range according to Leadfeeder's KPI breakdown. Those are useful reference points, but qualification rate after first meeting is what tells you whether lead gen is feeding the sales team anything worth their time.
Legal tech is a good example of why context matters. Deals involving buyers with a recent compliance incident have converted at 64% from opportunity to close, compared with 27% where that event signal wasn't present. That doesn't mean every legal tech team should chase the same trigger. It means qualification improves when your targeting includes a real buying catalyst.
How to diagnose a weak rate
You don't fix this from a dashboard alone. Go to the call recordings.
Write the criteria down: ICP fit, pain, authority, timing, and use case should exist before launch.
Log disqualification reasons: “No budget” and “wrong segment” should never be buried in free text.
Separate source performance: Phone, email, and LinkedIn meetings don't qualify at identical rates.
Review real conversations: Pull 5 to 10 Gong or Zoom recordings and find the repeated failure pattern.
Use the right internal process: A disciplined lead qualification process is what keeps this KPI clean.
A full calendar can hide a weak funnel for months. Qualification rate exposes it in one report.
For most revenue teams, this is the third KPI to track in the first 90 days. Reply rate tells you whether the market cares. CPQM tells you whether the economics work. Qualification rate tells you whether the output is real.
4. Pipeline coverage ratio
Once the first three KPIs are stable, I care about coverage. Activity finally gets translated into revenue pressure via coverage. If pipeline coverage is thin, your quarter is already in trouble even if current outreach metrics look fine.
The wider industry has moved away from using raw lead volume as the main success measure and toward cost, efficiency, conversion, and revenue outcomes, with modern dashboards grouped into volume, quality, cost and efficiency, and revenue and outcomes, as explained in SalesMotion's KPI framework. That's the right model. Coverage sits in the revenue layer because it exposes whether top-of-funnel work is enough to support the target.
Use coverage to expose future gaps
I prefer a simple operating view in HubSpot or Looker. Revenue target, current open opportunity value, close rate assumption, average contract value, and expected time to close. If that ratio is light, the team should know before the quarter gets missed.
A practical example makes the point. A €1M revenue target with a 28% close rate and €60k ACV requires about €3.6M in open pipeline coverage. If you're nowhere near that number, no amount of celebrating reply rates will save the quarter.
How to segment it properly
This KPI gets distorted when teams average unlike deals together.
Split by deal window: Fast and slow opportunities should not sit in one blended coverage model.
Split by source: Apollo outbound, paid inbound, partner-sourced, and founder-led deals behave differently.
Review by sales cycle pattern: Manufacturing often needs more forward coverage than faster-moving iGaming windows.
Tie it to process: Keep sales pipeline management linked to lead gen reporting, or marketing and sales will argue from different numbers.
One caution. Coverage is not a first-month KPI. It becomes useful after the first indicators have enough consistency behind them. Early on, it's too easy to confuse ambition with signal.
5. Qualified opportunity creation rate
A team can hit meeting targets for six straight weeks and still miss pipeline if too few of those meetings turn into sales-accepted opportunities. That is why qualified opportunity creation rate sits below the first three KPIs, but still matters early. After reply rate, cost per qualified meeting, and qualification rate stabilize, this metric shows whether the system is producing enough forecastable deals.
Count only opportunities an AE would keep in commit or best-case review. If the account misses ICP, lacks a defined problem, or has no realistic path to budget and authority, leave it out. CRM inflation starts here.
This KPI also needs context by industry. In SaaS, inflated opportunity counts usually come from broad targeting and weak discovery discipline. In manufacturing, the opposite problem is more common. Teams disqualify too aggressively because buying groups are slower and technical validation takes longer. In iGaming, timing is the filter. A prospect can look qualified on paper and still be months away because licensing, market-entry plans, or legal review are not aligned.
I track this as qualified opportunities created per rep per month and by source. HubSpot makes this easy if lifecycle stages are locked down and opportunity creation requires required fields. Clay, Sales Navigator, Apollo, and HeyReach can all generate meetings. They do not generate qualified opportunities on their own. The qualification standard and routing logic do that.
A simple operating rule helps. If meeting volume rises but qualified opportunities stay flat for 3 to 4 weeks, inspect discovery recordings and source quality before adding more outbound volume. If opportunities rise but pipeline still feels late, the problem usually sits in deal progression and sales cycle improvement work, not top-of-funnel output.
How to keep this metric clean in practice:
Use a strict opportunity definition: ICP fit, clear pain, a plausible commercial path, and AE acceptance.
Set targets from revenue math: Start with closed-won target, then work backward through close rate and average deal size to required opportunity count.
Segment by source and segment: Outbound email, referrals, paid inbound, founder-led, and partners produce different opportunity quality.
Audit rep-to-rep variation: One SDR creating 2 times more opportunities than peers often signals a qualification standard problem, not just better performance.
For teams working through kpis for lead generation, this is the checkpoint between activity and pipeline. It answers a hard question with little room for spin. Are you creating real opportunities at a rate that can support the number, or just producing meetings that look busy in the CRM?
6. Sales cycle velocity by deal window
Average sales cycle is one of the least useful averages in B2B. It smooths over the pattern you need to manage. In some sectors, especially iGaming, the underlying behavior is split into distinct windows.
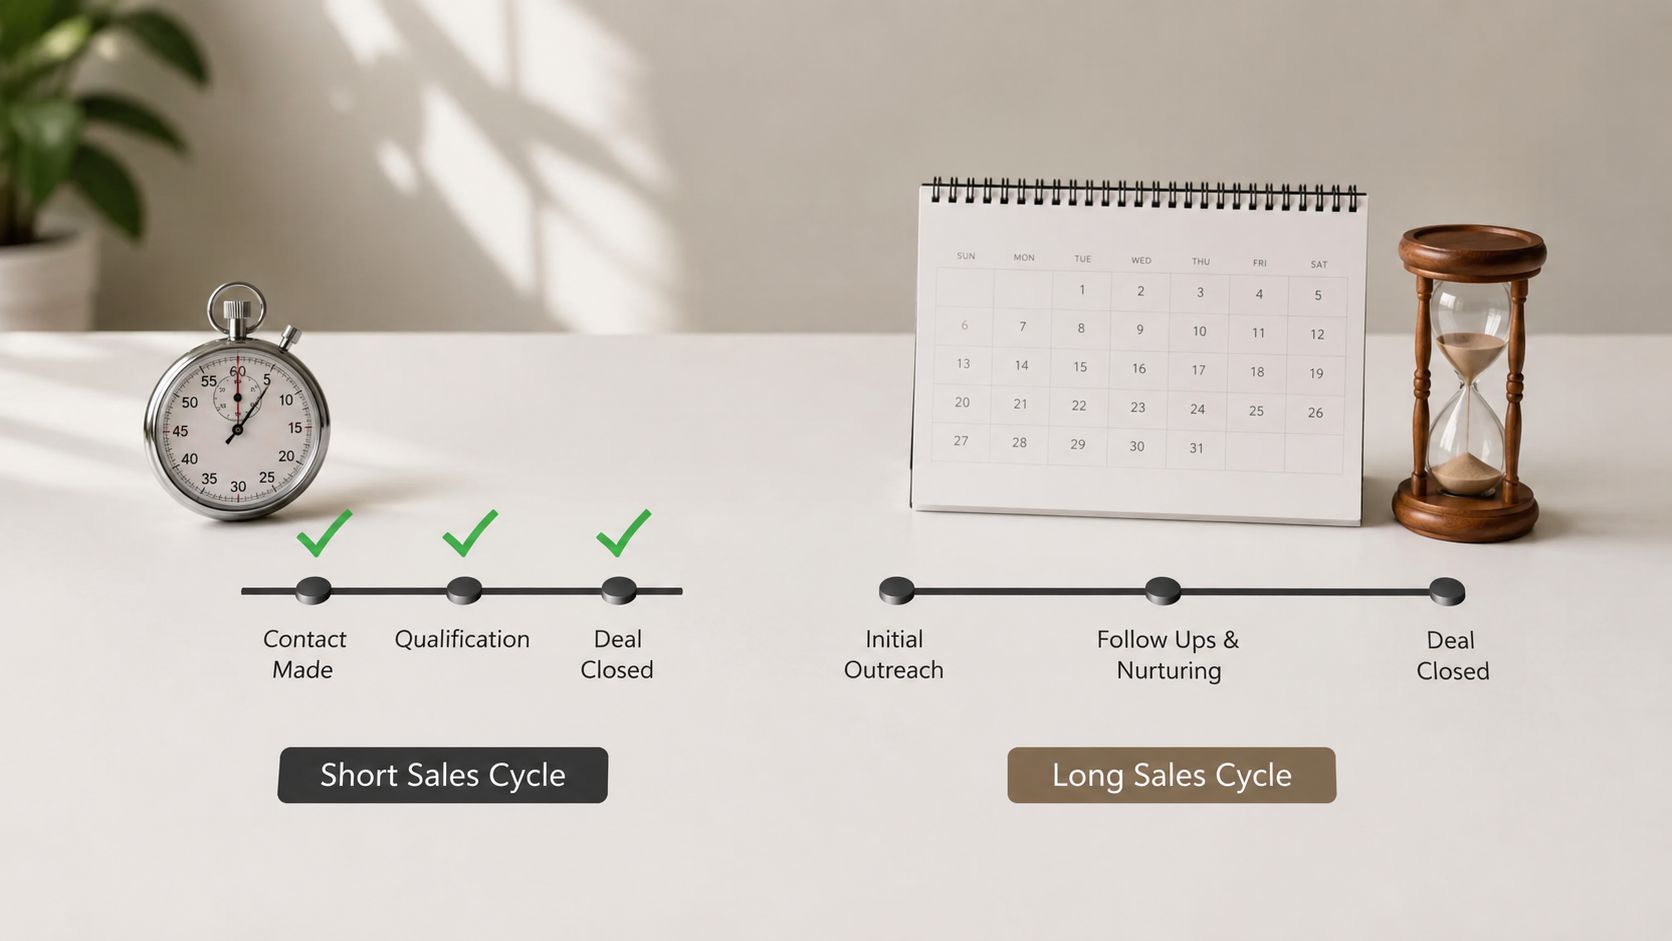
Across 47 closed iGaming B2B deals tracked across multiple clients, 31 closed in 35 to 60 days, 4 closed in 60 to 150 days, and 12 closed in 180 to 270+ days. Forecasting improved from roughly 55% to roughly 78% after adding explicit deal window classification. That's a better forecasting gain than most dashboard redesigns ever produce.
Why averages hide the real pattern
If you report one blended average sales cycle, the team learns the wrong lesson. A deal that misses the fast window often doesn't become a medium-speed deal. It becomes a slow one. In iGaming, that usually links back to regulation timing, market expansion timing, and whether budget and authority are already present in the first few conversations.
That's why velocity should sit inside the shorten the sales cycle discussion, not as an isolated sales metric. Lead gen influences velocity by deciding who enters the pipe and when.
How to classify fast and slow deals early
By conversation two or three, the AE should assign a provisional window. Fast window if there's budget, an active use case, and decision authority in the room. Slow window if interest is real but the buying cycle hasn't started.
Don't ask sales for a single average close time if the market buys in windows. Ask which window the deal belongs to.
A quick visual helps teams explain this internally:
This is one of the most underused kpis for lead generation because many teams think velocity belongs only to sales. It doesn't. Targeting determines whether you enter active buying cycles or just start long education tracks.
7. Meeting-to-opportunity conversion rate
This metric looks similar to qualification rate, but I treat it slightly differently. Qualification rate after first meeting tells you whether the funnel is generating the right conversations. Meeting-to-opportunity conversion rate tells you whether the AE is handling those conversations well enough to create a valid next stage.
That distinction matters in operator terms. If the meetings are decent but the conversion is weak, the problem may be call structure, discovery depth, or objection handling. If both metrics are weak, the problem is probably upstream.
This is a sales conversation KPI
I like this metric because it keeps sales coaching tied to pipeline rather than personality. In practice, the strongest teams review recordings monthly in Gong, update qualification notes in HubSpot, and compare conversion by source and by rep.
A manufacturing example makes this practical. Phone-led outreach often gets stronger initial engagement in that sector than digital-first motions. But if AEs treat those calls like generic discovery, conversion can still underperform. The channel got you in the room. The conversation still has to do its job.
What to fix when it drops
The diagnosis should be disciplined, not emotional.
Check source shift first: If channel mix changed, conversion may fall without any AE decline.
Review a small call set: Three to five recordings per rep is usually enough to spot repetition.
Look for qualification drift: Reps often loosen standards when meeting pressure rises.
Run calibration sessions: AEs should compare why one person advanced a deal and another disqualified a similar one.
One parenthetical aside matters here, because it causes a lot of false alarms: a drop in this KPI after a targeting expansion might be normal if you intentionally tested a looser segment.
Generally, this KPI belongs on the working dashboard, not the executive dashboard. Leadership needs to know if pipeline is being created. Frontline managers need to know which part of the conversation is breaking.
8. Cost per closed deal with 90-day lookback
This is the lagging KPI that keeps the rest honest. You can have good reply rates, acceptable CPQM, and a decent qualification rate, then still miss on actual deal economics. Cost per closed deal tells you whether the system creates revenue that can support itself.
I use a 90-day lookback because anything shorter is too noisy for most B2B motions. The whole point is to stop short-term activity metrics from pretending they're proof of success.
Why this validates the whole system
The operating threshold I use is about one closed deal per €15k of spend across a 90-day window, adjusted for ACV and sales cycle. It's not universal. Enterprise motions can carry much higher acquisition cost than smaller ACV services. But the principle is stable. If spend keeps rising faster than closed deals, the funnel isn't healthy.
This is also where a predictive dashboard needs humility. Even a disciplined forecasting setup usually works in ranges, not precision. A practical model links reply rate to meeting volume, meetings to opportunities, opportunities to closed-won, then measures rolling conversion rates over time. Closed revenue forecasting within a 90-day window tends to be directionally useful rather than exact.
How to use it without misleading yourself
You need segmentation, or this KPI becomes a blended average that nobody can act on.
Break by ACV band: A high-ticket enterprise deal and a lower-ACV mid-market deal should not share one target.
Break by industry: iGaming, SaaS, manufacturing, legal tech, and pharma don't close on the same rhythm.
Break by deal window: Fast-close and slow-close motions distort each other if combined.
Compare to expected gross economics: If the cost per close is structurally too high, fix the audience or offer before adding spend.
For teams serious about kpis for lead generation, this is the final test. The rest of the dashboard predicts. This one confirms.
Lead Generation KPIs, 8-Metric Comparison
Metric | 🔄 Implementation complexity | ⚡ Resource requirements | ⭐ Expected outcomes | 💡 Ideal use cases | 📊 Key advantages |
|---|---|---|---|---|---|
Reply rate on outbound touches | Low–Medium: measure over first 21 days, channel-segmented, requires ≥200 touches/week for reliability | Outbound volume, tracking per channel, sender accounts, basic analytics | Thresholds: <4% = broken; 4–8% = functional; 8–12% = working; 12%+ = strong | Early funnel diagnosis; A/B testing messages/ICP; channel selection | Earliest funnel signal; directly actionable; predicts meeting volume |
Cost per qualified meeting (CPQM) | Medium: needs 4–6 week window and CRM lifecycle discipline to separate qualified meetings | Full cost accounting (tools, labor, agency), attribution by campaign, ≥30 meetings for reliability | Benchmarks: <€400 strong; €400–700 acceptable; €700–€1,200 concerning; >€1,200 unsustainable | Validating unit economics before scaling; ACV-based budgeting | Ties spend to real pipeline; prevents scaling on vanity metrics |
Qualification rate after first meeting | Medium–High: requires documented qualification criteria and 6–10 week measurement window | CRM discipline, AE logging, meeting recordings, sample ≥30 meetings | <40% = significant problem; 40–60% = improvable; 60–75% = strong; 75%+ = exceptional | Testing ICP fit vs sales process; diagnosing where meetings fail to convert | Exposes true pipeline quality; points to ICP or process fixes |
Pipeline coverage ratio | High: needs historical close rates, stage-weighting and monthly updates | CRM + finance data, 90-day historical close rates, ACV inputs, stage-weighting logic | Typical target 3x–4x revenue for B2B SaaS; adjust for cycle and ACV | Revenue planning; identifying top-of-funnel gaps 60–90 days out | Connects lead-gen to revenue; enables proactive activity adjustments |
Qualified opportunity creation rate | Medium: rolling 30-day windows, strict ICP/qualification enforcement | CRM entry rules, source tracking, weekly monitoring, campaign attribution | Strong campaigns: ~8–15 qualified opps/week (mid-market SaaS); varies by vertical | Measuring actual pipeline output from outbound; forecasting opportunity flow | Directly measures lead-gen output; separates activity from outcome |
Sales cycle velocity by deal window | High: requires early deal-window classification and cohort tracking by window | First-touch accuracy, deal-window tagging in CRM, quarterly cohort analysis | Reveals bimodal distributions (e.g., fast 35–60d vs slow 180–270d) | Forecasting and prioritizing deals in industries with mixed cycle lengths | Separates fast vs slow revenue; improves prioritization and forecast accuracy |
Meeting-to-opportunity conversion rate | Medium: needs ≥30 meetings, consistent qualification criteria, meeting recordings/notes | AE training, call recording/review, CRM logging, per-AE tracking | Typical: 50–75% for well-qualified meetings; 40–50% signals process improvement | Isolating conversation quality vs lead quality; AE coaching focus | Pinpoints sales-process efficiency; actionable for coaching and calibration |
Cost per closed deal (90-day lookback) | High: lagging 90-day rolling window, requires robust attribution and enough closed deals | Finance integration, campaign attribution, ACV and deal-window segmentation | Rule of thumb ~€15k spend per closed deal (varies); compare vs LTV and ACV | Final ROI validation; deciding whether to scale or pause campaigns | Ultimate ROI metric; validates earlier KPIs translate to revenue |
Your next step audit your qualification rate
Stop guessing. This Friday, pull a report from your CRM of all first meetings held in the last 60 days. Add a column for “Progressed to Opportunity” and mark yes or no. Calculate the percentage. If it's below 60%, you've found the bottleneck that deserves attention first.
Then do one more step before Monday. Pull five recordings from the “no” group and five from the “yes” group. Compare them side by side. You're looking for repeated patterns in targeting, qualification, AE behavior, and handoff quality. Don't build a big strategy deck. Write down the three reasons deals progressed and the three reasons they stalled.
Teams often mishandle lead generation. They keep adding metrics instead of tightening definitions. The industry has already shifted away from raw lead volume as the main KPI and toward efficiency and revenue connection. The practical version of that shift is simple. Limit the dashboard, keep stage definitions strict, and focus on the few numbers that tell you whether attention is turning into pipeline.
If you're a founder, head of sales, head of marketing, or RevOps lead in iGaming, SaaS, manufacturing, legal tech, or pharma, don't let every campaign report its own version of success. One team counts meetings booked. Another counts MQLs. Another counts “pipeline created” without checking if the AE would ever forecast it. That's how reporting becomes political. The fix is a small KPI stack with one set of definitions across outbound, inbound, and sales.
A clean operating stack usually looks like this. Reply rate first. Cost per qualified meeting second. Qualification rate after first meeting third. Then layer in opportunity creation, coverage, velocity, meeting conversion, and cost per close once the first three have enough data behind them. That sequence matters because it matches how a funnel proves itself in the first 90 days.
Use named tools if they help the team work faster. Apollo for sequencing and sourcing, Clay for signal enrichment, Sales Navigator for account and contact context, HeyReach for LinkedIn execution, Lemlist or Smartlead for outbound infrastructure, HubSpot as the system of record, and Looker if you need a wider BI view. But don't confuse tool count with operating quality. A messy funnel in five tools is still a messy funnel.
If your dashboard is overloaded today, the next move isn't a redesign. It's subtraction. Cut the vanity metrics. Tighten the lifecycle rules. Force source-level reporting. Then watch what happens to decision quality over the next month.
GROU works with global B2B teams to turn content, outbound, and lead generation into one pipeline system. Our method is simple, one message, one target list, one reporting line, built for fit and speed, and supported by practical operating discipline plus content that earns attention, whether that means tighter CRM reporting or even small engagement assets like prepare engaging quiz questions.
If your team needs a stricter lead generation operating system, Grou is built for that. We help B2B teams connect targeting, outbound, qualification, and reporting so the dashboard reflects pipeline reality, not just activity.
Your lead generation dashboard is a liar. You're staring at charts for opens, clicks, meeting volume, and MQLs. The graphs look healthy, but revenue feels flat. The numbers show activity, not whether the system is producing pipeline.
Structure turns attention into pipeline. That means tracking the few metrics that predict revenue, not the dozens that measure motion. Clean reporting also depends on basics like data quality governance, because bad stage data makes even a polished dashboard useless.
The three leading indicators that predict funnel success in the first 90 days
Actionable thresholds that tell you when to scale and when to stop
Industry-specific benchmarks for iGaming, SaaS, manufacturing, and legal tech
A system for connecting leading indicators to lagging revenue milestones
Table of Contents
1. Reply rate on outbound touches
If I'm assessing a new funnel, this is the first number I check. Not opens. Not clicks. Not meetings booked. Reply rate tells you whether the audience, message, and timing are working at all.
For B2B lead generation engagement, top-performing campaigns hit 20 to 30% engagement on email and social content, and that level is tied to stronger MQL conversion according to Martal's lead generation KPI benchmarks. In outbound, the tighter operating threshold I use is simpler. Under 4% is broken, 4 to 8% is functional, 8 to 12% is working, 12%+ is strong.
Why this is the first KPI
You need enough replies before any downstream metric means much. If a sequence in Apollo or Smartlead can't generate responses, there's nothing worth scaling in HubSpot later. That's why reply rate is the foundation KPI in most outbound systems, especially for teams running cold email programs.
Manufacturing is where this becomes obvious fast. In that market, email-first outreach often lags, while phone-led campaigns have produced connect-to-meeting rates of 11 to 16%. That changed channel strategy entirely for several teams we've seen. The lesson wasn't “write better emails.” It was “stop forcing a SaaS motion onto a manufacturing buyer.”
Practical rule: Don't judge reply rate in the first few days. Judge it after enough volume and after the sequence has had time to run.
What to do when reply rate is weak
Teams often edit copy too early. The actual fix is usually upstream.
Check ICP definition: If reply rate is below 4% for 21+ days with enough weekly volume, the list or offer is usually wrong.
Split by channel: Email, LinkedIn through HeyReach, and phone should never be blended into one response metric.
Separate real replies: Auto-responses, referrals, and out-of-office replies inflate the view if you don't tag them.
Review intent tiers: High-intent leads need a lead response time under 5 minutes, while lower-intent leads can tolerate up to 24 hours, as noted in MarketBetter's KPI guidance.
For teams tracking kpis for lead generation, this is the first signal that tells the truth quickly. If it's weak, pause scale and rebuild the list, the message, or both.
2. Cost per qualified meeting
A team can book 30 meetings in a month and still miss pipeline. I have seen that happen when paid media, SDR time, and data costs were optimized for calendar volume instead of buyer fit. Cost per qualified meeting is one of the three KPIs I check first because it shows whether spend is producing sales-usable conversations, not activity.
The working formula is simple:
CPQM = total lead generation spend ÷ number of meetings that meet your qualification standard
For most B2B teams, I use these bands as an operating guide. Under €400 is strong. €400 to €700 is workable. €700 to €1,200 needs investigation. Above €1,200 only makes sense if deal size, margin, and close rate support it.
What belongs in the calculation
Count the full acquisition cost. That means list build, enrichment tools like Apollo or Clay, outbound platforms, paid channel spend, SDR or agency labor, and sales time if your reps are doing first-touch qualification. If labor is missing, CPQM looks better on paper than it is in the budget.
The other half is the definition of “qualified.” Keep it tight. A booked intro is not enough. In HubSpot or Salesforce, I want a meeting marked qualified only after it matches the ICP, has a live need, and clears the bar defined in your lead qualification process for sales handoff. If you already use an appointment setting system, tie that output to the same rule set or the metric will drift.
Benchmarks by market
The useful benchmark is not one global average. It is the cost range your market can absorb.
SaaS: Lower-friction categories can often tolerate a lower CPQM because volume is higher and outreach is easier to automate.
Manufacturing: CPQM is often higher, especially when phone, trade list data, and rep research do more of the work.
iGaming: Costs rise fast when compliance limits targeting options and only a narrow segment of accounts can buy.
That is why CPQM belongs near reply rate and qualification rate in the first 90 days. Reply rate shows whether the market will engage. CPQM shows what that engagement costs to turn into a real sales conversation.
Where teams get this wrong
High CPQM usually starts upstream.
Targeting is too broad: Extra meetings from weak-fit accounts push cost up because they consume paid spend and rep time without becoming pipeline.
Channel mix is blended: LinkedIn, cold email, paid search, and phone produce very different economics. Track CPQM by source.
Qualification rules are soft: If one SDR marks any positive call as qualified, CPQM looks lower until sales rejects the meetings later.
Reviews happen too slowly: Use a rolling 30-day view and a source-level view. Monthly totals hide channel problems.
One more practical rule. Do not try to fix a high CPQM by editing one email step first. Start with account selection, source mix, and qualification criteria. Those three usually move the number faster than copy changes.
For teams serious about kpis for lead generation, CPQM is the spend discipline metric. If reply rate is healthy but CPQM is still high, the system is paying too much for fit.
3. Qualification rate after first meeting
This is the KPI most often hidden behind glossy reporting. Agencies love booked meetings because booked meetings are easy to count. Operators care about what happens after the first call.
If fewer than 40% of held meetings progress to opportunity, the funnel has a qualification problem. A 40 to 60% rate needs work. A 60 to 75% rate is strong. Above that is rare enough that I want to inspect the definitions before celebrating.
The threshold that matters
For small to mid-sized B2B teams, 200 to 500 leads per month is considered a solid benchmark, while SQL-to-deal conversion ideally lands in the 20 to 30% range according to Leadfeeder's KPI breakdown. Those are useful reference points, but qualification rate after first meeting is what tells you whether lead gen is feeding the sales team anything worth their time.
Legal tech is a good example of why context matters. Deals involving buyers with a recent compliance incident have converted at 64% from opportunity to close, compared with 27% where that event signal wasn't present. That doesn't mean every legal tech team should chase the same trigger. It means qualification improves when your targeting includes a real buying catalyst.
How to diagnose a weak rate
You don't fix this from a dashboard alone. Go to the call recordings.
Write the criteria down: ICP fit, pain, authority, timing, and use case should exist before launch.
Log disqualification reasons: “No budget” and “wrong segment” should never be buried in free text.
Separate source performance: Phone, email, and LinkedIn meetings don't qualify at identical rates.
Review real conversations: Pull 5 to 10 Gong or Zoom recordings and find the repeated failure pattern.
Use the right internal process: A disciplined lead qualification process is what keeps this KPI clean.
A full calendar can hide a weak funnel for months. Qualification rate exposes it in one report.
For most revenue teams, this is the third KPI to track in the first 90 days. Reply rate tells you whether the market cares. CPQM tells you whether the economics work. Qualification rate tells you whether the output is real.
4. Pipeline coverage ratio
Once the first three KPIs are stable, I care about coverage. Activity finally gets translated into revenue pressure via coverage. If pipeline coverage is thin, your quarter is already in trouble even if current outreach metrics look fine.
The wider industry has moved away from using raw lead volume as the main success measure and toward cost, efficiency, conversion, and revenue outcomes, with modern dashboards grouped into volume, quality, cost and efficiency, and revenue and outcomes, as explained in SalesMotion's KPI framework. That's the right model. Coverage sits in the revenue layer because it exposes whether top-of-funnel work is enough to support the target.
Use coverage to expose future gaps
I prefer a simple operating view in HubSpot or Looker. Revenue target, current open opportunity value, close rate assumption, average contract value, and expected time to close. If that ratio is light, the team should know before the quarter gets missed.
A practical example makes the point. A €1M revenue target with a 28% close rate and €60k ACV requires about €3.6M in open pipeline coverage. If you're nowhere near that number, no amount of celebrating reply rates will save the quarter.
How to segment it properly
This KPI gets distorted when teams average unlike deals together.
Split by deal window: Fast and slow opportunities should not sit in one blended coverage model.
Split by source: Apollo outbound, paid inbound, partner-sourced, and founder-led deals behave differently.
Review by sales cycle pattern: Manufacturing often needs more forward coverage than faster-moving iGaming windows.
Tie it to process: Keep sales pipeline management linked to lead gen reporting, or marketing and sales will argue from different numbers.
One caution. Coverage is not a first-month KPI. It becomes useful after the first indicators have enough consistency behind them. Early on, it's too easy to confuse ambition with signal.
5. Qualified opportunity creation rate
A team can hit meeting targets for six straight weeks and still miss pipeline if too few of those meetings turn into sales-accepted opportunities. That is why qualified opportunity creation rate sits below the first three KPIs, but still matters early. After reply rate, cost per qualified meeting, and qualification rate stabilize, this metric shows whether the system is producing enough forecastable deals.
Count only opportunities an AE would keep in commit or best-case review. If the account misses ICP, lacks a defined problem, or has no realistic path to budget and authority, leave it out. CRM inflation starts here.
This KPI also needs context by industry. In SaaS, inflated opportunity counts usually come from broad targeting and weak discovery discipline. In manufacturing, the opposite problem is more common. Teams disqualify too aggressively because buying groups are slower and technical validation takes longer. In iGaming, timing is the filter. A prospect can look qualified on paper and still be months away because licensing, market-entry plans, or legal review are not aligned.
I track this as qualified opportunities created per rep per month and by source. HubSpot makes this easy if lifecycle stages are locked down and opportunity creation requires required fields. Clay, Sales Navigator, Apollo, and HeyReach can all generate meetings. They do not generate qualified opportunities on their own. The qualification standard and routing logic do that.
A simple operating rule helps. If meeting volume rises but qualified opportunities stay flat for 3 to 4 weeks, inspect discovery recordings and source quality before adding more outbound volume. If opportunities rise but pipeline still feels late, the problem usually sits in deal progression and sales cycle improvement work, not top-of-funnel output.
How to keep this metric clean in practice:
Use a strict opportunity definition: ICP fit, clear pain, a plausible commercial path, and AE acceptance.
Set targets from revenue math: Start with closed-won target, then work backward through close rate and average deal size to required opportunity count.
Segment by source and segment: Outbound email, referrals, paid inbound, founder-led, and partners produce different opportunity quality.
Audit rep-to-rep variation: One SDR creating 2 times more opportunities than peers often signals a qualification standard problem, not just better performance.
For teams working through kpis for lead generation, this is the checkpoint between activity and pipeline. It answers a hard question with little room for spin. Are you creating real opportunities at a rate that can support the number, or just producing meetings that look busy in the CRM?
6. Sales cycle velocity by deal window
Average sales cycle is one of the least useful averages in B2B. It smooths over the pattern you need to manage. In some sectors, especially iGaming, the underlying behavior is split into distinct windows.
Across 47 closed iGaming B2B deals tracked across multiple clients, 31 closed in 35 to 60 days, 4 closed in 60 to 150 days, and 12 closed in 180 to 270+ days. Forecasting improved from roughly 55% to roughly 78% after adding explicit deal window classification. That's a better forecasting gain than most dashboard redesigns ever produce.
Why averages hide the real pattern
If you report one blended average sales cycle, the team learns the wrong lesson. A deal that misses the fast window often doesn't become a medium-speed deal. It becomes a slow one. In iGaming, that usually links back to regulation timing, market expansion timing, and whether budget and authority are already present in the first few conversations.
That's why velocity should sit inside the shorten the sales cycle discussion, not as an isolated sales metric. Lead gen influences velocity by deciding who enters the pipe and when.
How to classify fast and slow deals early
By conversation two or three, the AE should assign a provisional window. Fast window if there's budget, an active use case, and decision authority in the room. Slow window if interest is real but the buying cycle hasn't started.
Don't ask sales for a single average close time if the market buys in windows. Ask which window the deal belongs to.
A quick visual helps teams explain this internally:
This is one of the most underused kpis for lead generation because many teams think velocity belongs only to sales. It doesn't. Targeting determines whether you enter active buying cycles or just start long education tracks.
7. Meeting-to-opportunity conversion rate
This metric looks similar to qualification rate, but I treat it slightly differently. Qualification rate after first meeting tells you whether the funnel is generating the right conversations. Meeting-to-opportunity conversion rate tells you whether the AE is handling those conversations well enough to create a valid next stage.
That distinction matters in operator terms. If the meetings are decent but the conversion is weak, the problem may be call structure, discovery depth, or objection handling. If both metrics are weak, the problem is probably upstream.
This is a sales conversation KPI
I like this metric because it keeps sales coaching tied to pipeline rather than personality. In practice, the strongest teams review recordings monthly in Gong, update qualification notes in HubSpot, and compare conversion by source and by rep.
A manufacturing example makes this practical. Phone-led outreach often gets stronger initial engagement in that sector than digital-first motions. But if AEs treat those calls like generic discovery, conversion can still underperform. The channel got you in the room. The conversation still has to do its job.
What to fix when it drops
The diagnosis should be disciplined, not emotional.
Check source shift first: If channel mix changed, conversion may fall without any AE decline.
Review a small call set: Three to five recordings per rep is usually enough to spot repetition.
Look for qualification drift: Reps often loosen standards when meeting pressure rises.
Run calibration sessions: AEs should compare why one person advanced a deal and another disqualified a similar one.
One parenthetical aside matters here, because it causes a lot of false alarms: a drop in this KPI after a targeting expansion might be normal if you intentionally tested a looser segment.
Generally, this KPI belongs on the working dashboard, not the executive dashboard. Leadership needs to know if pipeline is being created. Frontline managers need to know which part of the conversation is breaking.
8. Cost per closed deal with 90-day lookback
This is the lagging KPI that keeps the rest honest. You can have good reply rates, acceptable CPQM, and a decent qualification rate, then still miss on actual deal economics. Cost per closed deal tells you whether the system creates revenue that can support itself.
I use a 90-day lookback because anything shorter is too noisy for most B2B motions. The whole point is to stop short-term activity metrics from pretending they're proof of success.
Why this validates the whole system
The operating threshold I use is about one closed deal per €15k of spend across a 90-day window, adjusted for ACV and sales cycle. It's not universal. Enterprise motions can carry much higher acquisition cost than smaller ACV services. But the principle is stable. If spend keeps rising faster than closed deals, the funnel isn't healthy.
This is also where a predictive dashboard needs humility. Even a disciplined forecasting setup usually works in ranges, not precision. A practical model links reply rate to meeting volume, meetings to opportunities, opportunities to closed-won, then measures rolling conversion rates over time. Closed revenue forecasting within a 90-day window tends to be directionally useful rather than exact.
How to use it without misleading yourself
You need segmentation, or this KPI becomes a blended average that nobody can act on.
Break by ACV band: A high-ticket enterprise deal and a lower-ACV mid-market deal should not share one target.
Break by industry: iGaming, SaaS, manufacturing, legal tech, and pharma don't close on the same rhythm.
Break by deal window: Fast-close and slow-close motions distort each other if combined.
Compare to expected gross economics: If the cost per close is structurally too high, fix the audience or offer before adding spend.
For teams serious about kpis for lead generation, this is the final test. The rest of the dashboard predicts. This one confirms.
Lead Generation KPIs, 8-Metric Comparison
Metric | 🔄 Implementation complexity | ⚡ Resource requirements | ⭐ Expected outcomes | 💡 Ideal use cases | 📊 Key advantages |
|---|---|---|---|---|---|
Reply rate on outbound touches | Low–Medium: measure over first 21 days, channel-segmented, requires ≥200 touches/week for reliability | Outbound volume, tracking per channel, sender accounts, basic analytics | Thresholds: <4% = broken; 4–8% = functional; 8–12% = working; 12%+ = strong | Early funnel diagnosis; A/B testing messages/ICP; channel selection | Earliest funnel signal; directly actionable; predicts meeting volume |
Cost per qualified meeting (CPQM) | Medium: needs 4–6 week window and CRM lifecycle discipline to separate qualified meetings | Full cost accounting (tools, labor, agency), attribution by campaign, ≥30 meetings for reliability | Benchmarks: <€400 strong; €400–700 acceptable; €700–€1,200 concerning; >€1,200 unsustainable | Validating unit economics before scaling; ACV-based budgeting | Ties spend to real pipeline; prevents scaling on vanity metrics |
Qualification rate after first meeting | Medium–High: requires documented qualification criteria and 6–10 week measurement window | CRM discipline, AE logging, meeting recordings, sample ≥30 meetings | <40% = significant problem; 40–60% = improvable; 60–75% = strong; 75%+ = exceptional | Testing ICP fit vs sales process; diagnosing where meetings fail to convert | Exposes true pipeline quality; points to ICP or process fixes |
Pipeline coverage ratio | High: needs historical close rates, stage-weighting and monthly updates | CRM + finance data, 90-day historical close rates, ACV inputs, stage-weighting logic | Typical target 3x–4x revenue for B2B SaaS; adjust for cycle and ACV | Revenue planning; identifying top-of-funnel gaps 60–90 days out | Connects lead-gen to revenue; enables proactive activity adjustments |
Qualified opportunity creation rate | Medium: rolling 30-day windows, strict ICP/qualification enforcement | CRM entry rules, source tracking, weekly monitoring, campaign attribution | Strong campaigns: ~8–15 qualified opps/week (mid-market SaaS); varies by vertical | Measuring actual pipeline output from outbound; forecasting opportunity flow | Directly measures lead-gen output; separates activity from outcome |
Sales cycle velocity by deal window | High: requires early deal-window classification and cohort tracking by window | First-touch accuracy, deal-window tagging in CRM, quarterly cohort analysis | Reveals bimodal distributions (e.g., fast 35–60d vs slow 180–270d) | Forecasting and prioritizing deals in industries with mixed cycle lengths | Separates fast vs slow revenue; improves prioritization and forecast accuracy |
Meeting-to-opportunity conversion rate | Medium: needs ≥30 meetings, consistent qualification criteria, meeting recordings/notes | AE training, call recording/review, CRM logging, per-AE tracking | Typical: 50–75% for well-qualified meetings; 40–50% signals process improvement | Isolating conversation quality vs lead quality; AE coaching focus | Pinpoints sales-process efficiency; actionable for coaching and calibration |
Cost per closed deal (90-day lookback) | High: lagging 90-day rolling window, requires robust attribution and enough closed deals | Finance integration, campaign attribution, ACV and deal-window segmentation | Rule of thumb ~€15k spend per closed deal (varies); compare vs LTV and ACV | Final ROI validation; deciding whether to scale or pause campaigns | Ultimate ROI metric; validates earlier KPIs translate to revenue |
Your next step audit your qualification rate
Stop guessing. This Friday, pull a report from your CRM of all first meetings held in the last 60 days. Add a column for “Progressed to Opportunity” and mark yes or no. Calculate the percentage. If it's below 60%, you've found the bottleneck that deserves attention first.
Then do one more step before Monday. Pull five recordings from the “no” group and five from the “yes” group. Compare them side by side. You're looking for repeated patterns in targeting, qualification, AE behavior, and handoff quality. Don't build a big strategy deck. Write down the three reasons deals progressed and the three reasons they stalled.
Teams often mishandle lead generation. They keep adding metrics instead of tightening definitions. The industry has already shifted away from raw lead volume as the main KPI and toward efficiency and revenue connection. The practical version of that shift is simple. Limit the dashboard, keep stage definitions strict, and focus on the few numbers that tell you whether attention is turning into pipeline.
If you're a founder, head of sales, head of marketing, or RevOps lead in iGaming, SaaS, manufacturing, legal tech, or pharma, don't let every campaign report its own version of success. One team counts meetings booked. Another counts MQLs. Another counts “pipeline created” without checking if the AE would ever forecast it. That's how reporting becomes political. The fix is a small KPI stack with one set of definitions across outbound, inbound, and sales.
A clean operating stack usually looks like this. Reply rate first. Cost per qualified meeting second. Qualification rate after first meeting third. Then layer in opportunity creation, coverage, velocity, meeting conversion, and cost per close once the first three have enough data behind them. That sequence matters because it matches how a funnel proves itself in the first 90 days.
Use named tools if they help the team work faster. Apollo for sequencing and sourcing, Clay for signal enrichment, Sales Navigator for account and contact context, HeyReach for LinkedIn execution, Lemlist or Smartlead for outbound infrastructure, HubSpot as the system of record, and Looker if you need a wider BI view. But don't confuse tool count with operating quality. A messy funnel in five tools is still a messy funnel.
If your dashboard is overloaded today, the next move isn't a redesign. It's subtraction. Cut the vanity metrics. Tighten the lifecycle rules. Force source-level reporting. Then watch what happens to decision quality over the next month.
GROU works with global B2B teams to turn content, outbound, and lead generation into one pipeline system. Our method is simple, one message, one target list, one reporting line, built for fit and speed, and supported by practical operating discipline plus content that earns attention, whether that means tighter CRM reporting or even small engagement assets like prepare engaging quiz questions.
If your team needs a stricter lead generation operating system, Grou is built for that. We help B2B teams connect targeting, outbound, qualification, and reporting so the dashboard reflects pipeline reality, not just activity.
Your lead generation dashboard is a liar. You're staring at charts for opens, clicks, meeting volume, and MQLs. The graphs look healthy, but revenue feels flat. The numbers show activity, not whether the system is producing pipeline.
Structure turns attention into pipeline. That means tracking the few metrics that predict revenue, not the dozens that measure motion. Clean reporting also depends on basics like data quality governance, because bad stage data makes even a polished dashboard useless.
The three leading indicators that predict funnel success in the first 90 days
Actionable thresholds that tell you when to scale and when to stop
Industry-specific benchmarks for iGaming, SaaS, manufacturing, and legal tech
A system for connecting leading indicators to lagging revenue milestones
Table of Contents
1. Reply rate on outbound touches
If I'm assessing a new funnel, this is the first number I check. Not opens. Not clicks. Not meetings booked. Reply rate tells you whether the audience, message, and timing are working at all.
For B2B lead generation engagement, top-performing campaigns hit 20 to 30% engagement on email and social content, and that level is tied to stronger MQL conversion according to Martal's lead generation KPI benchmarks. In outbound, the tighter operating threshold I use is simpler. Under 4% is broken, 4 to 8% is functional, 8 to 12% is working, 12%+ is strong.
Why this is the first KPI
You need enough replies before any downstream metric means much. If a sequence in Apollo or Smartlead can't generate responses, there's nothing worth scaling in HubSpot later. That's why reply rate is the foundation KPI in most outbound systems, especially for teams running cold email programs.
Manufacturing is where this becomes obvious fast. In that market, email-first outreach often lags, while phone-led campaigns have produced connect-to-meeting rates of 11 to 16%. That changed channel strategy entirely for several teams we've seen. The lesson wasn't “write better emails.” It was “stop forcing a SaaS motion onto a manufacturing buyer.”
Practical rule: Don't judge reply rate in the first few days. Judge it after enough volume and after the sequence has had time to run.
What to do when reply rate is weak
Teams often edit copy too early. The actual fix is usually upstream.
Check ICP definition: If reply rate is below 4% for 21+ days with enough weekly volume, the list or offer is usually wrong.
Split by channel: Email, LinkedIn through HeyReach, and phone should never be blended into one response metric.
Separate real replies: Auto-responses, referrals, and out-of-office replies inflate the view if you don't tag them.
Review intent tiers: High-intent leads need a lead response time under 5 minutes, while lower-intent leads can tolerate up to 24 hours, as noted in MarketBetter's KPI guidance.
For teams tracking kpis for lead generation, this is the first signal that tells the truth quickly. If it's weak, pause scale and rebuild the list, the message, or both.
2. Cost per qualified meeting
A team can book 30 meetings in a month and still miss pipeline. I have seen that happen when paid media, SDR time, and data costs were optimized for calendar volume instead of buyer fit. Cost per qualified meeting is one of the three KPIs I check first because it shows whether spend is producing sales-usable conversations, not activity.
The working formula is simple:
CPQM = total lead generation spend ÷ number of meetings that meet your qualification standard
For most B2B teams, I use these bands as an operating guide. Under €400 is strong. €400 to €700 is workable. €700 to €1,200 needs investigation. Above €1,200 only makes sense if deal size, margin, and close rate support it.
What belongs in the calculation
Count the full acquisition cost. That means list build, enrichment tools like Apollo or Clay, outbound platforms, paid channel spend, SDR or agency labor, and sales time if your reps are doing first-touch qualification. If labor is missing, CPQM looks better on paper than it is in the budget.
The other half is the definition of “qualified.” Keep it tight. A booked intro is not enough. In HubSpot or Salesforce, I want a meeting marked qualified only after it matches the ICP, has a live need, and clears the bar defined in your lead qualification process for sales handoff. If you already use an appointment setting system, tie that output to the same rule set or the metric will drift.
Benchmarks by market
The useful benchmark is not one global average. It is the cost range your market can absorb.
SaaS: Lower-friction categories can often tolerate a lower CPQM because volume is higher and outreach is easier to automate.
Manufacturing: CPQM is often higher, especially when phone, trade list data, and rep research do more of the work.
iGaming: Costs rise fast when compliance limits targeting options and only a narrow segment of accounts can buy.
That is why CPQM belongs near reply rate and qualification rate in the first 90 days. Reply rate shows whether the market will engage. CPQM shows what that engagement costs to turn into a real sales conversation.
Where teams get this wrong
High CPQM usually starts upstream.
Targeting is too broad: Extra meetings from weak-fit accounts push cost up because they consume paid spend and rep time without becoming pipeline.
Channel mix is blended: LinkedIn, cold email, paid search, and phone produce very different economics. Track CPQM by source.
Qualification rules are soft: If one SDR marks any positive call as qualified, CPQM looks lower until sales rejects the meetings later.
Reviews happen too slowly: Use a rolling 30-day view and a source-level view. Monthly totals hide channel problems.
One more practical rule. Do not try to fix a high CPQM by editing one email step first. Start with account selection, source mix, and qualification criteria. Those three usually move the number faster than copy changes.
For teams serious about kpis for lead generation, CPQM is the spend discipline metric. If reply rate is healthy but CPQM is still high, the system is paying too much for fit.
3. Qualification rate after first meeting
This is the KPI most often hidden behind glossy reporting. Agencies love booked meetings because booked meetings are easy to count. Operators care about what happens after the first call.
If fewer than 40% of held meetings progress to opportunity, the funnel has a qualification problem. A 40 to 60% rate needs work. A 60 to 75% rate is strong. Above that is rare enough that I want to inspect the definitions before celebrating.
The threshold that matters
For small to mid-sized B2B teams, 200 to 500 leads per month is considered a solid benchmark, while SQL-to-deal conversion ideally lands in the 20 to 30% range according to Leadfeeder's KPI breakdown. Those are useful reference points, but qualification rate after first meeting is what tells you whether lead gen is feeding the sales team anything worth their time.
Legal tech is a good example of why context matters. Deals involving buyers with a recent compliance incident have converted at 64% from opportunity to close, compared with 27% where that event signal wasn't present. That doesn't mean every legal tech team should chase the same trigger. It means qualification improves when your targeting includes a real buying catalyst.
How to diagnose a weak rate
You don't fix this from a dashboard alone. Go to the call recordings.
Write the criteria down: ICP fit, pain, authority, timing, and use case should exist before launch.
Log disqualification reasons: “No budget” and “wrong segment” should never be buried in free text.
Separate source performance: Phone, email, and LinkedIn meetings don't qualify at identical rates.
Review real conversations: Pull 5 to 10 Gong or Zoom recordings and find the repeated failure pattern.
Use the right internal process: A disciplined lead qualification process is what keeps this KPI clean.
A full calendar can hide a weak funnel for months. Qualification rate exposes it in one report.
For most revenue teams, this is the third KPI to track in the first 90 days. Reply rate tells you whether the market cares. CPQM tells you whether the economics work. Qualification rate tells you whether the output is real.
4. Pipeline coverage ratio
Once the first three KPIs are stable, I care about coverage. Activity finally gets translated into revenue pressure via coverage. If pipeline coverage is thin, your quarter is already in trouble even if current outreach metrics look fine.
The wider industry has moved away from using raw lead volume as the main success measure and toward cost, efficiency, conversion, and revenue outcomes, with modern dashboards grouped into volume, quality, cost and efficiency, and revenue and outcomes, as explained in SalesMotion's KPI framework. That's the right model. Coverage sits in the revenue layer because it exposes whether top-of-funnel work is enough to support the target.
Use coverage to expose future gaps
I prefer a simple operating view in HubSpot or Looker. Revenue target, current open opportunity value, close rate assumption, average contract value, and expected time to close. If that ratio is light, the team should know before the quarter gets missed.
A practical example makes the point. A €1M revenue target with a 28% close rate and €60k ACV requires about €3.6M in open pipeline coverage. If you're nowhere near that number, no amount of celebrating reply rates will save the quarter.
How to segment it properly
This KPI gets distorted when teams average unlike deals together.
Split by deal window: Fast and slow opportunities should not sit in one blended coverage model.
Split by source: Apollo outbound, paid inbound, partner-sourced, and founder-led deals behave differently.
Review by sales cycle pattern: Manufacturing often needs more forward coverage than faster-moving iGaming windows.
Tie it to process: Keep sales pipeline management linked to lead gen reporting, or marketing and sales will argue from different numbers.
One caution. Coverage is not a first-month KPI. It becomes useful after the first indicators have enough consistency behind them. Early on, it's too easy to confuse ambition with signal.
5. Qualified opportunity creation rate
A team can hit meeting targets for six straight weeks and still miss pipeline if too few of those meetings turn into sales-accepted opportunities. That is why qualified opportunity creation rate sits below the first three KPIs, but still matters early. After reply rate, cost per qualified meeting, and qualification rate stabilize, this metric shows whether the system is producing enough forecastable deals.
Count only opportunities an AE would keep in commit or best-case review. If the account misses ICP, lacks a defined problem, or has no realistic path to budget and authority, leave it out. CRM inflation starts here.
This KPI also needs context by industry. In SaaS, inflated opportunity counts usually come from broad targeting and weak discovery discipline. In manufacturing, the opposite problem is more common. Teams disqualify too aggressively because buying groups are slower and technical validation takes longer. In iGaming, timing is the filter. A prospect can look qualified on paper and still be months away because licensing, market-entry plans, or legal review are not aligned.
I track this as qualified opportunities created per rep per month and by source. HubSpot makes this easy if lifecycle stages are locked down and opportunity creation requires required fields. Clay, Sales Navigator, Apollo, and HeyReach can all generate meetings. They do not generate qualified opportunities on their own. The qualification standard and routing logic do that.
A simple operating rule helps. If meeting volume rises but qualified opportunities stay flat for 3 to 4 weeks, inspect discovery recordings and source quality before adding more outbound volume. If opportunities rise but pipeline still feels late, the problem usually sits in deal progression and sales cycle improvement work, not top-of-funnel output.
How to keep this metric clean in practice:
Use a strict opportunity definition: ICP fit, clear pain, a plausible commercial path, and AE acceptance.
Set targets from revenue math: Start with closed-won target, then work backward through close rate and average deal size to required opportunity count.
Segment by source and segment: Outbound email, referrals, paid inbound, founder-led, and partners produce different opportunity quality.
Audit rep-to-rep variation: One SDR creating 2 times more opportunities than peers often signals a qualification standard problem, not just better performance.
For teams working through kpis for lead generation, this is the checkpoint between activity and pipeline. It answers a hard question with little room for spin. Are you creating real opportunities at a rate that can support the number, or just producing meetings that look busy in the CRM?
6. Sales cycle velocity by deal window
Average sales cycle is one of the least useful averages in B2B. It smooths over the pattern you need to manage. In some sectors, especially iGaming, the underlying behavior is split into distinct windows.
Across 47 closed iGaming B2B deals tracked across multiple clients, 31 closed in 35 to 60 days, 4 closed in 60 to 150 days, and 12 closed in 180 to 270+ days. Forecasting improved from roughly 55% to roughly 78% after adding explicit deal window classification. That's a better forecasting gain than most dashboard redesigns ever produce.
Why averages hide the real pattern
If you report one blended average sales cycle, the team learns the wrong lesson. A deal that misses the fast window often doesn't become a medium-speed deal. It becomes a slow one. In iGaming, that usually links back to regulation timing, market expansion timing, and whether budget and authority are already present in the first few conversations.
That's why velocity should sit inside the shorten the sales cycle discussion, not as an isolated sales metric. Lead gen influences velocity by deciding who enters the pipe and when.
How to classify fast and slow deals early
By conversation two or three, the AE should assign a provisional window. Fast window if there's budget, an active use case, and decision authority in the room. Slow window if interest is real but the buying cycle hasn't started.
Don't ask sales for a single average close time if the market buys in windows. Ask which window the deal belongs to.
A quick visual helps teams explain this internally:
This is one of the most underused kpis for lead generation because many teams think velocity belongs only to sales. It doesn't. Targeting determines whether you enter active buying cycles or just start long education tracks.
7. Meeting-to-opportunity conversion rate
This metric looks similar to qualification rate, but I treat it slightly differently. Qualification rate after first meeting tells you whether the funnel is generating the right conversations. Meeting-to-opportunity conversion rate tells you whether the AE is handling those conversations well enough to create a valid next stage.
That distinction matters in operator terms. If the meetings are decent but the conversion is weak, the problem may be call structure, discovery depth, or objection handling. If both metrics are weak, the problem is probably upstream.
This is a sales conversation KPI
I like this metric because it keeps sales coaching tied to pipeline rather than personality. In practice, the strongest teams review recordings monthly in Gong, update qualification notes in HubSpot, and compare conversion by source and by rep.
A manufacturing example makes this practical. Phone-led outreach often gets stronger initial engagement in that sector than digital-first motions. But if AEs treat those calls like generic discovery, conversion can still underperform. The channel got you in the room. The conversation still has to do its job.
What to fix when it drops
The diagnosis should be disciplined, not emotional.
Check source shift first: If channel mix changed, conversion may fall without any AE decline.
Review a small call set: Three to five recordings per rep is usually enough to spot repetition.
Look for qualification drift: Reps often loosen standards when meeting pressure rises.
Run calibration sessions: AEs should compare why one person advanced a deal and another disqualified a similar one.
One parenthetical aside matters here, because it causes a lot of false alarms: a drop in this KPI after a targeting expansion might be normal if you intentionally tested a looser segment.
Generally, this KPI belongs on the working dashboard, not the executive dashboard. Leadership needs to know if pipeline is being created. Frontline managers need to know which part of the conversation is breaking.
8. Cost per closed deal with 90-day lookback
This is the lagging KPI that keeps the rest honest. You can have good reply rates, acceptable CPQM, and a decent qualification rate, then still miss on actual deal economics. Cost per closed deal tells you whether the system creates revenue that can support itself.
I use a 90-day lookback because anything shorter is too noisy for most B2B motions. The whole point is to stop short-term activity metrics from pretending they're proof of success.
Why this validates the whole system
The operating threshold I use is about one closed deal per €15k of spend across a 90-day window, adjusted for ACV and sales cycle. It's not universal. Enterprise motions can carry much higher acquisition cost than smaller ACV services. But the principle is stable. If spend keeps rising faster than closed deals, the funnel isn't healthy.
This is also where a predictive dashboard needs humility. Even a disciplined forecasting setup usually works in ranges, not precision. A practical model links reply rate to meeting volume, meetings to opportunities, opportunities to closed-won, then measures rolling conversion rates over time. Closed revenue forecasting within a 90-day window tends to be directionally useful rather than exact.
How to use it without misleading yourself
You need segmentation, or this KPI becomes a blended average that nobody can act on.
Break by ACV band: A high-ticket enterprise deal and a lower-ACV mid-market deal should not share one target.
Break by industry: iGaming, SaaS, manufacturing, legal tech, and pharma don't close on the same rhythm.
Break by deal window: Fast-close and slow-close motions distort each other if combined.
Compare to expected gross economics: If the cost per close is structurally too high, fix the audience or offer before adding spend.
For teams serious about kpis for lead generation, this is the final test. The rest of the dashboard predicts. This one confirms.
Lead Generation KPIs, 8-Metric Comparison
Metric | 🔄 Implementation complexity | ⚡ Resource requirements | ⭐ Expected outcomes | 💡 Ideal use cases | 📊 Key advantages |
|---|---|---|---|---|---|
Reply rate on outbound touches | Low–Medium: measure over first 21 days, channel-segmented, requires ≥200 touches/week for reliability | Outbound volume, tracking per channel, sender accounts, basic analytics | Thresholds: <4% = broken; 4–8% = functional; 8–12% = working; 12%+ = strong | Early funnel diagnosis; A/B testing messages/ICP; channel selection | Earliest funnel signal; directly actionable; predicts meeting volume |
Cost per qualified meeting (CPQM) | Medium: needs 4–6 week window and CRM lifecycle discipline to separate qualified meetings | Full cost accounting (tools, labor, agency), attribution by campaign, ≥30 meetings for reliability | Benchmarks: <€400 strong; €400–700 acceptable; €700–€1,200 concerning; >€1,200 unsustainable | Validating unit economics before scaling; ACV-based budgeting | Ties spend to real pipeline; prevents scaling on vanity metrics |
Qualification rate after first meeting | Medium–High: requires documented qualification criteria and 6–10 week measurement window | CRM discipline, AE logging, meeting recordings, sample ≥30 meetings | <40% = significant problem; 40–60% = improvable; 60–75% = strong; 75%+ = exceptional | Testing ICP fit vs sales process; diagnosing where meetings fail to convert | Exposes true pipeline quality; points to ICP or process fixes |
Pipeline coverage ratio | High: needs historical close rates, stage-weighting and monthly updates | CRM + finance data, 90-day historical close rates, ACV inputs, stage-weighting logic | Typical target 3x–4x revenue for B2B SaaS; adjust for cycle and ACV | Revenue planning; identifying top-of-funnel gaps 60–90 days out | Connects lead-gen to revenue; enables proactive activity adjustments |
Qualified opportunity creation rate | Medium: rolling 30-day windows, strict ICP/qualification enforcement | CRM entry rules, source tracking, weekly monitoring, campaign attribution | Strong campaigns: ~8–15 qualified opps/week (mid-market SaaS); varies by vertical | Measuring actual pipeline output from outbound; forecasting opportunity flow | Directly measures lead-gen output; separates activity from outcome |
Sales cycle velocity by deal window | High: requires early deal-window classification and cohort tracking by window | First-touch accuracy, deal-window tagging in CRM, quarterly cohort analysis | Reveals bimodal distributions (e.g., fast 35–60d vs slow 180–270d) | Forecasting and prioritizing deals in industries with mixed cycle lengths | Separates fast vs slow revenue; improves prioritization and forecast accuracy |
Meeting-to-opportunity conversion rate | Medium: needs ≥30 meetings, consistent qualification criteria, meeting recordings/notes | AE training, call recording/review, CRM logging, per-AE tracking | Typical: 50–75% for well-qualified meetings; 40–50% signals process improvement | Isolating conversation quality vs lead quality; AE coaching focus | Pinpoints sales-process efficiency; actionable for coaching and calibration |
Cost per closed deal (90-day lookback) | High: lagging 90-day rolling window, requires robust attribution and enough closed deals | Finance integration, campaign attribution, ACV and deal-window segmentation | Rule of thumb ~€15k spend per closed deal (varies); compare vs LTV and ACV | Final ROI validation; deciding whether to scale or pause campaigns | Ultimate ROI metric; validates earlier KPIs translate to revenue |
Your next step audit your qualification rate
Stop guessing. This Friday, pull a report from your CRM of all first meetings held in the last 60 days. Add a column for “Progressed to Opportunity” and mark yes or no. Calculate the percentage. If it's below 60%, you've found the bottleneck that deserves attention first.
Then do one more step before Monday. Pull five recordings from the “no” group and five from the “yes” group. Compare them side by side. You're looking for repeated patterns in targeting, qualification, AE behavior, and handoff quality. Don't build a big strategy deck. Write down the three reasons deals progressed and the three reasons they stalled.
Teams often mishandle lead generation. They keep adding metrics instead of tightening definitions. The industry has already shifted away from raw lead volume as the main KPI and toward efficiency and revenue connection. The practical version of that shift is simple. Limit the dashboard, keep stage definitions strict, and focus on the few numbers that tell you whether attention is turning into pipeline.
If you're a founder, head of sales, head of marketing, or RevOps lead in iGaming, SaaS, manufacturing, legal tech, or pharma, don't let every campaign report its own version of success. One team counts meetings booked. Another counts MQLs. Another counts “pipeline created” without checking if the AE would ever forecast it. That's how reporting becomes political. The fix is a small KPI stack with one set of definitions across outbound, inbound, and sales.
A clean operating stack usually looks like this. Reply rate first. Cost per qualified meeting second. Qualification rate after first meeting third. Then layer in opportunity creation, coverage, velocity, meeting conversion, and cost per close once the first three have enough data behind them. That sequence matters because it matches how a funnel proves itself in the first 90 days.
Use named tools if they help the team work faster. Apollo for sequencing and sourcing, Clay for signal enrichment, Sales Navigator for account and contact context, HeyReach for LinkedIn execution, Lemlist or Smartlead for outbound infrastructure, HubSpot as the system of record, and Looker if you need a wider BI view. But don't confuse tool count with operating quality. A messy funnel in five tools is still a messy funnel.
If your dashboard is overloaded today, the next move isn't a redesign. It's subtraction. Cut the vanity metrics. Tighten the lifecycle rules. Force source-level reporting. Then watch what happens to decision quality over the next month.
GROU works with global B2B teams to turn content, outbound, and lead generation into one pipeline system. Our method is simple, one message, one target list, one reporting line, built for fit and speed, and supported by practical operating discipline plus content that earns attention, whether that means tighter CRM reporting or even small engagement assets like prepare engaging quiz questions.
If your team needs a stricter lead generation operating system, Grou is built for that. We help B2B teams connect targeting, outbound, qualification, and reporting so the dashboard reflects pipeline reality, not just activity.
Pipeline OS Newsletter
Build qualified pipeline
Get weekly tactics to generate demand, improve lead quality, and book more meetings.





Trusted by industry leaders
Trusted by industry leaders
Trusted by industry leaders
Ready to build qualified pipeline?
Ready to build qualified pipeline?
Ready to build qualified pipeline?
Book a call to see if we're the right fit, or take the 2-minute quiz to get a clear starting point.
Book a call to see if we're the right fit, or take the 2-minute quiz to get a clear starting point.
Book a call to see if we're the right fit, or take the 2-minute quiz to get a clear starting point.
" height="30.21639343089746px" id="hfGbXmQR2" width="30.216393430897455px"/></svg>)
Copyright © 2026 – All Right Reserved
Copyright © 2026 – All Right Reserved
Copyright © 2026 – All Right Reserved