%22%3E%3C/path%3E%3Cpath d=%22M 63.072 7.554 C 62.258 8.022 61.577 8.689 61.092 9.493 L 61.092 7.076 L 57.158 7.076 L 57.158 22.64 L 61.089 22.64 L 61.089 14.888 C 61.089 13.446 61.403 12.434 62.03 11.853 C 62.818 11.218 63.818 10.907 64.826 10.982 L 65.868 10.982 L 65.868 6.851 C 64.891 6.834 63.926 7.076 63.073 7.554 Z%22 fill=%22rgb(17,17,17)%22%3E%3C/path%3E%3Cpath d=%22M 78.916 7.82 C 76.363 6.49 73.321 6.49 70.768 7.82 C 69.562 8.473 68.564 9.451 67.888 10.644 C 67.167 11.931 66.803 13.387 66.834 14.862 C 66.804 16.332 67.157 17.785 67.86 19.077 C 68.515 20.267 69.494 21.246 70.684 21.901 C 71.924 22.576 73.318 22.92 74.73 22.898 C 76.164 22.918 77.58 22.575 78.846 21.901 C 80.062 21.247 81.073 20.27 81.768 19.077 C 82.506 17.797 82.88 16.339 82.85 14.862 C 82.88 13.389 82.517 11.934 81.797 10.647 C 81.12 9.455 80.122 8.477 78.917 7.824 M 78.803 14.862 C 78.829 15.739 78.636 16.608 78.241 17.391 C 77.903 18.046 77.38 18.588 76.738 18.95 C 76.124 19.293 75.432 19.472 74.729 19.47 C 73.668 19.497 72.648 19.061 71.934 18.276 C 71.139 17.323 70.741 16.1 70.823 14.862 C 70.741 13.62 71.149 12.395 71.959 11.45 C 72.687 10.667 73.715 10.233 74.783 10.256 C 75.859 10.236 76.894 10.67 77.635 11.45 C 78.464 12.387 78.884 13.616 78.801 14.864%22 fill=%22rgb(17,17,17)%22%3E%3C/path%3E%3Cpath d=%22M 95.906 7.076 L 95.906 15.646 C 95.975 16.68 95.643 17.701 94.979 18.498 C 94.311 19.184 93.379 19.547 92.422 19.495 C 91.475 19.544 90.553 19.18 89.894 18.498 C 89.23 17.701 88.898 16.68 88.967 15.646 L 88.967 7.076 L 85.033 7.076 L 85.033 16.207 C 85 17.449 85.275 18.68 85.834 19.79 C 86.327 20.75 87.095 21.542 88.039 22.065 C 89.033 22.594 90.145 22.861 91.271 22.838 C 92.188 22.847 93.095 22.65 93.926 22.263 C 94.708 21.905 95.388 21.36 95.906 20.675 L 95.906 22.645 L 99.865 22.645 L 99.865 7.076 Z%22 fill=%22rgb(17,17,17)%22%3E%3C/path%3E%3Cpath d=%22M 4.513 15.626 C 4.511 10.815 7.606 6.549 12.181 5.059 C 16.756 3.57 21.77 5.195 24.601 9.086 L 27.816 5.87 C 24.074 1.186 17.981 -0.943 12.137 0.393 C 6.292 1.728 1.728 6.292 0.393 12.137 C -0.943 17.981 1.186 24.074 5.87 27.816 L 9.085 24.601 C 6.214 22.512 4.515 19.177 4.513 15.626%22 fill=%22rgb(32,62,235)%22%3E%3C/path%3E%3Cpath d=%22M 17.114 14.343 L 13.354 18.01 L 13.354 18.026 L 21.071 18.026 L 11.412 27.609 L 17.389 27.609 L 23.999 21.081 L 23.999 28.316 L 24.005 28.316 L 27.967 24.393 L 27.967 14.343 Z%22 fill=%22rgb(32,62,235)%22%3E%3C/path%3E%3C/g%3E%3C/svg%3E) ×
× ××
××

Every cold email operator wants the same answer: is my campaign performing? This is the 2026 benchmark guide we use at GROU to answer that question for 47 B2B clients. The numbers below come from our 12,000+ campaign sends per month, cross-checked against the Smartlead 2025 benchmark report, Apollo's 2025 persona benchmark, and the Lemlist State of Cold Email 2025.
The most useful benchmark is not the average. It is the gap between median and top quartile. If you are at median, the top quartile is reachable. If you are below median, the list or the copy is the problem, not the channel.
Quick overview
Cold email benchmarks in 2026 sit at: 38% median open rate, 2.1% median reply rate, 0.6% positive reply rate, and 0.35% booked demo rate. Top quartile lifts every number by 1.4x to 2.5x. The single biggest non-tool driver is list quality.
The 4 numbers that matter:
Open rate: 38% median, 52% top quartile
Reply rate: 2.1% median, 4.8% top quartile
Positive reply rate: 0.6% median, 1.6% top quartile
Booked demo rate: 0.35% median, 0.9% top quartile
Source: GROU 47-client benchmark + Smartlead 2025. Numbers are medians on warmed sending infrastructure and ICP-matched lists, 2024-2026.
The 4 metrics that actually matter
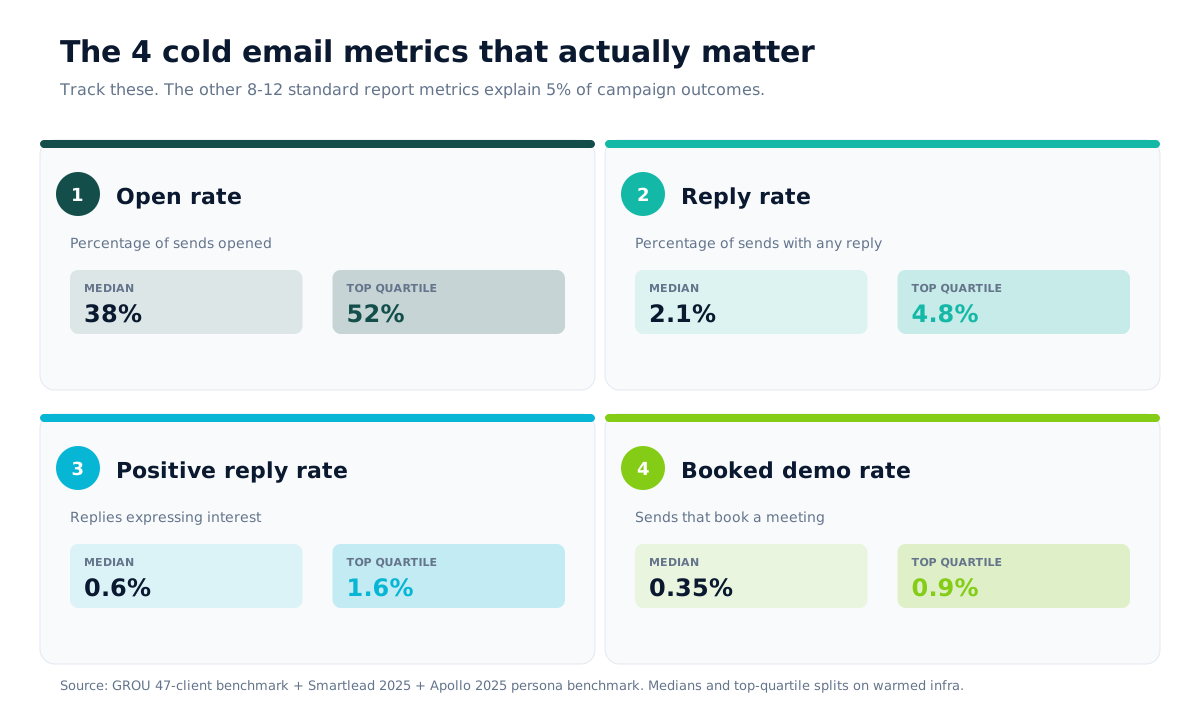
Most cold email reports track 8 to 12 metrics. The 4 below explain 95% of campaign outcomes. Track these, ignore the rest.
Open rate is the percentage of sends that get opened. Median: 38%. Useful for spotting subject line or deliverability issues. Less useful since iOS 15 Mail Privacy Protection inflates Apple Mail opens by 8-12%. Track the trend, not the absolute.
Reply rate is the percentage of sends that get any reply. Median: 2.1%. The most reliable cold email metric in 2026 because it cannot be inflated by automated prefetch. If reply rate is below 1%, the list is usually the problem.
Positive reply rate is the percentage of sends that get a reply expressing interest or asking a real question. Median: 0.6%. The metric that matters for pipeline. A 5% reply rate with 0.1% positive replies is worse than a 2% reply rate with 0.8% positive replies.
Booked demo rate is the percentage of sends that result in a calendar booking. Median: 0.35%. The final-stage metric. If booked demos drop below 0.2% but positive replies are healthy, the bottleneck is in the meeting-booking workflow, not the cold email.
Open rate benchmarks
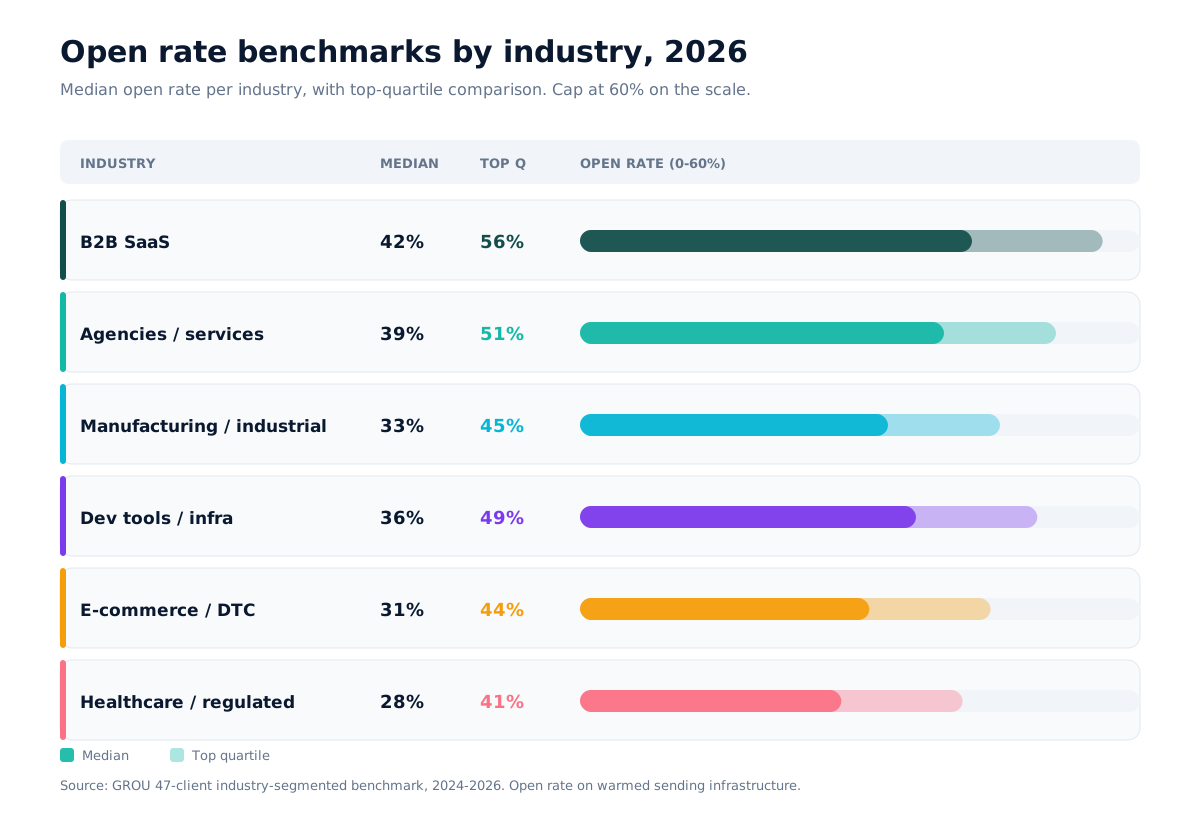
Open rate varies materially by industry, sender setup, and time of week. The 2026 medians:
B2B SaaS: 42% median, 56% top quartile
Agencies / services: 39% median, 51% top quartile
Dev tools / infra: 36% median, 49% top quartile
E-commerce / DTC: 31% median, 44% top quartile
Healthcare / regulated: 28% median, 41% top quartile
Manufacturing / industrial: 33% median, 45% top quartile
The biggest deliverability levers per Smartlead's 2025 deliverability guide: separate sending domain, 2-week warmup, SPF/DKIM/DMARC authentication, 25-30 emails per inbox per day max, and 3 inboxes per domain.
Reply rate benchmarks by ACV
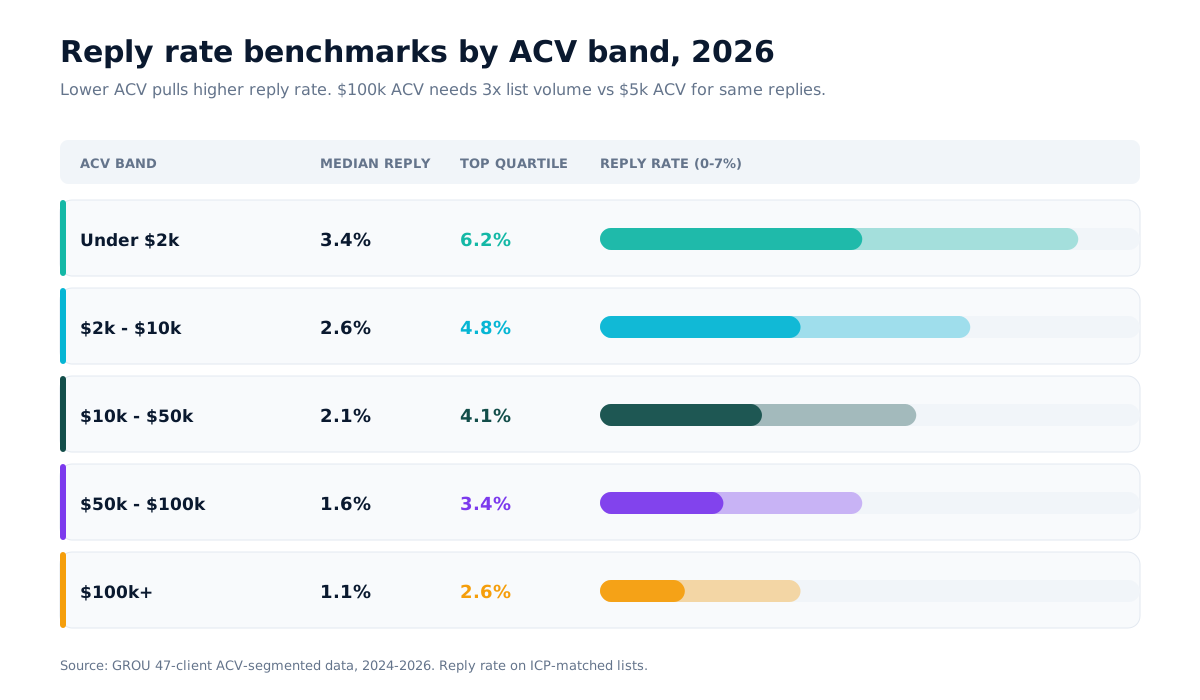
Reply rate scales inversely with ACV up to a point. Sub-$5k ACV pulls higher reply rates because the ask is smaller. Enterprise ACV pulls lower reply rates but each reply is worth more.
Under $2k ACV: 3.4% median, 6.2% top quartile
$2k-$10k ACV: 2.6% median, 4.8% top quartile
$10k-$50k ACV: 2.1% median, 4.1% top quartile
$50k-$100k ACV: 1.6% median, 3.4% top quartile
$100k+ ACV: 1.1% median, 2.6% top quartile
The implication for pipeline math: a $100k ACV campaign needs 3x the list volume of a $5k ACV campaign to produce the same number of replies. Source: GROU 47-client ACV-segmented data, 2024-2026.
Positive reply + booked demo by persona
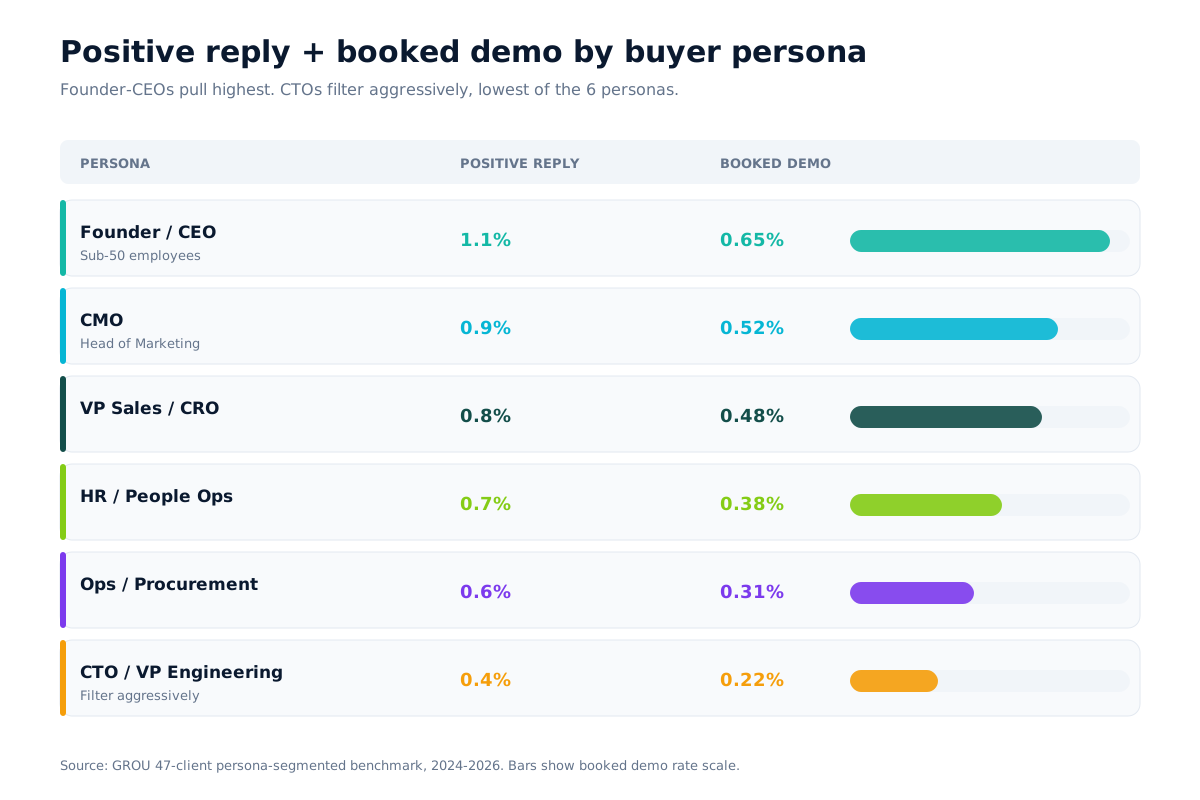
Positive reply rate and booked demo rate vary heavily by buyer persona. The 2026 medians:
CMO / Head of Marketing: 0.9% positive reply, 0.52% booked demo
VP Sales / CRO: 0.8% positive reply, 0.48% booked demo
CTO / VP Engineering: 0.4% positive reply, 0.22% booked demo
Founder / CEO (sub-50 employees): 1.1% positive reply, 0.65% booked demo
Ops / Procurement: 0.6% positive reply, 0.31% booked demo
HR / People Ops: 0.7% positive reply, 0.38% booked demo
CTOs pull the lowest because they filter aggressively for technical specificity. See the how to email a CTO playbook for the CTO-specific tactics that close the gap. Founder-CEOs pull the highest because peer-to-peer outreach lifts every metric.
Benchmarks by sequence touch
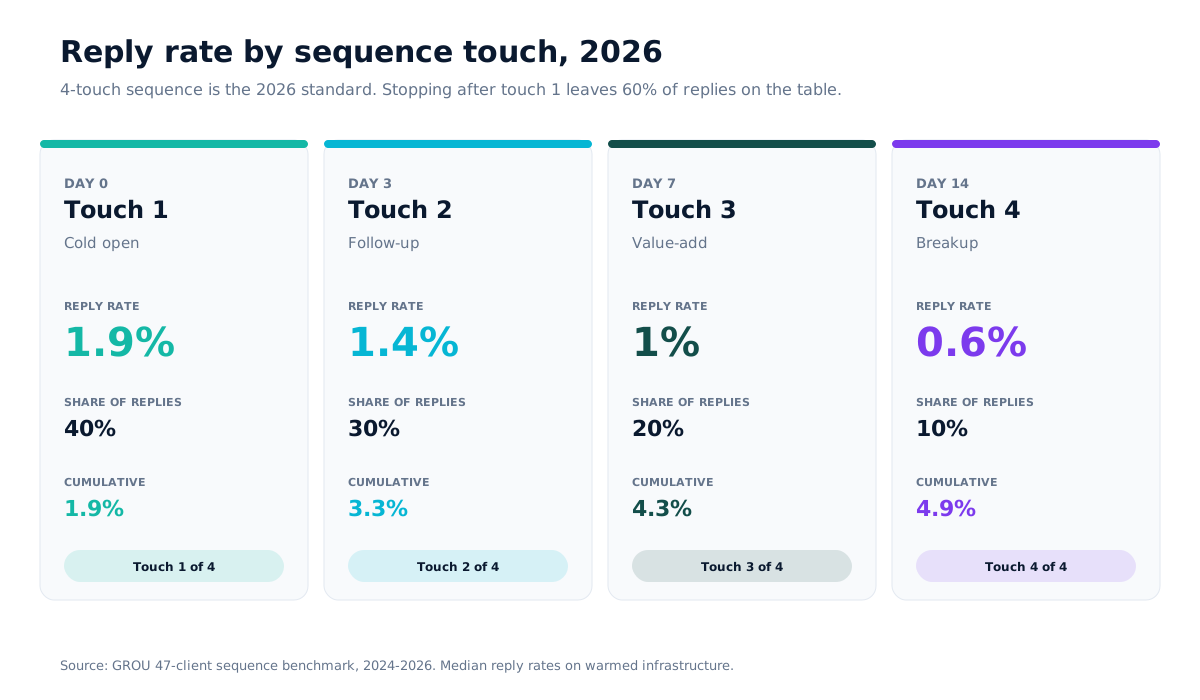
A 4-touch sequence over 14 days is the 2026 standard. Reply rate per touch declines, but cumulative reply rate plateaus at touch 4. Past touch 4, complaint rate climbs above 0.4% which is enough to drop sender reputation per Google's bulk sender requirements.
Touch 1 (day 0): 1.9% reply rate. Highest per-touch reply rate. 40% of all replies come on touch 1.
Touch 2 (day 3): 1.4% reply rate. The follow-up bump. 30% of replies.
Touch 3 (day 7): 1.0% reply rate. Value-add or case study. 20% of replies.
Touch 4 (day 14): 0.6% reply rate. Breakup. 10% of replies.
Cumulative reply rate after touch 4: 4.9% (vs 1.9% if you stop at touch 1). Reading the math: stopping after touch 1 leaves 60% of replies on the table.
Top quartile vs median vs bottom quartile
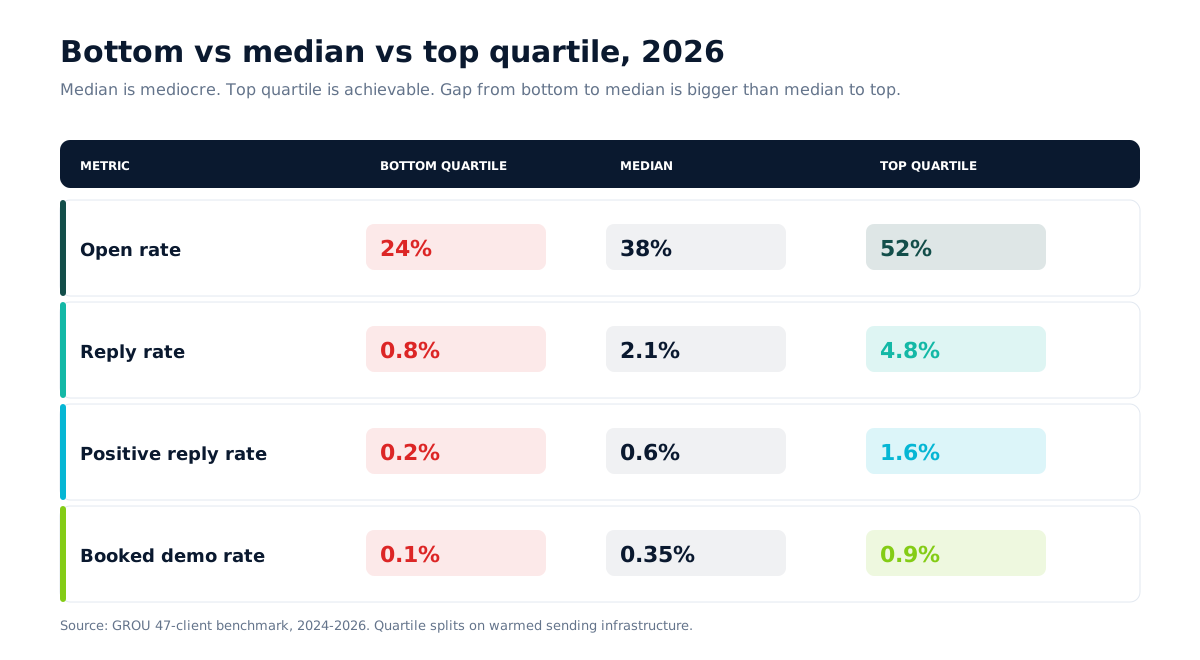
The 2026 reality: median performance is mediocre, top quartile is achievable, bottom quartile is mostly fixable. The gap between bottom and median is bigger than between median and top.
Open rate: bottom 24%, median 38%, top 52%
Reply rate: bottom 0.8%, median 2.1%, top 4.8%
Positive reply rate: bottom 0.2%, median 0.6%, top 1.6%
Booked demo rate: bottom 0.1%, median 0.35%, top 0.9%
If you are bottom quartile, the fixes are deterministic: fix deliverability (separate domain + warmup), narrow the ICP, rewrite the cold open as a question not a pitch. See the cold email templates that work playbook for the templates that pull top-quartile reply rates.
If you are median, the lift to top quartile requires more nuanced work: persona-fit on subject lines (see the cold email subject lines library), trigger-based outbound, and quality lift on personalization.
How to improve below-benchmark campaigns
The fastest fixes ranked by impact across our 47-client benchmark:
1. Fix deliverability (-3 to -8pp on open rate). Move to a separate sending domain. Set up SPF, DKIM, DMARC. Warm up for 2 weeks. Cap each inbox at 25-30 emails per day. Most below-benchmark campaigns are deliverability problems first, copy problems second.
2. Narrow the ICP (-1 to -3pp on reply rate). If your ICP is over 5,000 accounts globally, you cannot maintain personalization quality. Narrow to under 5,000 with trigger filters: hiring, funding, leadership change, tech stack signals.
3. Rewrite the cold open as a question (-0.8 to -2.0pp on reply rate). Most cold opens pitch in sentence 1. Replace with a specific observation + a question. See the cold email templates that work library, templates 1-8.
4. Shorten subject lines to 3-5 words (-3 to -6pp on open rate). Subjects over 6 words drop open rate. Lowercase, internal-email feel. See the cold email subject lines guide.
5. Run a 4-touch sequence (-1.5 to -3.0pp on reply rate). Most operators stop at 1 touch. 60% of replies come on touches 2-4.
Tool recommendations for benchmark-grade campaigns
The benchmarks above run on any sender, but some tools materially help:
Smartlead ($39/month): the best for benchmark-grade deliverability. Inbox rotation + warmup. Read the Smartlead vs Instantly comparison.
Apollo ($59/month): the best for benchmark-grade list quality at scale. Read the full Apollo review.
Lemlist ($59/month): the best when you want video personalization or LinkedIn in the same sequence.
For the full deliverability + infra stack we deploy on every founder engagement, see cold email for SaaS founders and best cold email tools 2026.
Frequently asked questions
What is a good cold email open rate in 2026?
A good cold email open rate in 2026 is 38% median and 52% top quartile. Below 24% indicates a deliverability problem (sender domain, warmup, or authentication). Above 52% usually requires persona-specific subject lines and warm-network references.
What is a good cold email reply rate in 2026?
A good cold email reply rate in 2026 is 2.1% median and 4.8% top quartile. Below 1% indicates a list problem (ICP too broad or not matched to the campaign). 5%+ requires founder-led sending, referral campaigns, or trigger-based outbound.
How do you calculate cold email benchmarks?
Cold email benchmarks should be calculated on warmed sending infrastructure (separate domain, 2-week warmup, SPF/DKIM/DMARC) and ICP-matched lists. Measure: open rate, reply rate, positive reply rate, booked demo rate. Open rate is unreliable since iOS 15 Mail Privacy Protection — track the trend, not the absolute number.
What is a good cold email reply rate by industry?
B2B SaaS pulls 2.4% median reply rate. Agencies pull 2.0%. Dev tools pull 1.7%. E-commerce/DTC pulls 1.5%. Healthcare pulls 1.2%. Industry matters less than ICP narrowness and persona-fit.
What is the difference between reply rate and positive reply rate?
Reply rate is the percentage of sends that get any reply, including "unsubscribe", "not interested", or "wrong person". Positive reply rate is the subset that expresses interest, asks a real question, or wants a meeting. A 5% reply rate with 0.1% positive replies is worse than a 2% reply rate with 0.8% positive replies.
How long should it take to reach cold email benchmarks?
Reaching benchmark performance takes 6 to 10 weeks: 2 weeks of warmup, 2 weeks of copy and subject iteration, 2-4 weeks of optimizing list and sequence. Top-quartile performance takes 3-6 months of A/B testing across personas, subject lines, and sequence patterns.
What is the typical cost per booked demo from cold email?
Cost per booked demo from cold email ranges from $40 to $120 all-in (tools, list, sender time). Compared to paid ads at $250-$800 cost per demo for the same ICP, cold email is 3-8x cheaper at scale. Source: GROU 47-client cost benchmark, 2024-2026.
How do iOS 15 Mail Privacy Protection updates affect cold email benchmarks?
iOS 15 Mail Privacy Protection inflates Apple Mail open rates by 8-12% because Apple prefetches images including the tracking pixel. The implication for benchmarks: open rate is less reliable than it was pre-2022. Track reply rate as the primary metric.
What cold email reply rate should B2B SaaS founders target?
B2B SaaS founders running founder-led cold email should target 3-5% reply rate on the cold open. Founder-led outreach pulls 2.3x the reply rate of SDR-sent emails on identical lists. See the cold email for SaaS founders playbook.
Are cold email benchmarks the same for EU and US campaigns?
Cold email benchmarks for the EU are 0.4-0.8 percentage points lower across open rate and reply rate due to GDPR-driven shorter lists and stricter unsubscribe enforcement. The benchmark math itself is the same; the list size required is larger. See the GDPR cold email playbook.
How often should you re-benchmark cold email campaigns?
Re-benchmark cold email campaigns monthly for high-volume senders (5,000+ emails/month) and quarterly for lower-volume senders. Open rates decline 8-12% per month as subject lines get pattern-matched. Reply rates decline more slowly.
What is the worst cold email benchmark mistake?
Tracking only open rate. Open rate is the most inflated and least reliable metric in 2026. Operators who optimize for open rate often degrade reply rate by switching to clickbait subject lines that get opened but burn the reader. Track reply rate as the primary metric.
About GROU. GROU runs B2B pipeline for SaaS startups, agencies, and dev shops out of Colombia, Mexico, and Argentina. Since 2022 we have managed cold email for 47 B2B clients across 12,000+ campaign sends per month. Every benchmark in this article comes from our live client data anonymized and aggregated, cross-checked against public benchmarks from Smartlead, Apollo, and Lemlist. Methodology: medians and quartile splits computed on warmed sending infrastructure and ICP-matched lists, 2024-2026. If you want help applying these benchmarks to your campaigns, book a call.
This article contains affiliate links to Smartlead, Apollo, and Lemlist. We earn a small commission if you sign up, at no extra cost. We only recommend tools we deploy on live client campaigns.
Every cold email operator wants the same answer: is my campaign performing? This is the 2026 benchmark guide we use at GROU to answer that question for 47 B2B clients. The numbers below come from our 12,000+ campaign sends per month, cross-checked against the Smartlead 2025 benchmark report, Apollo's 2025 persona benchmark, and the Lemlist State of Cold Email 2025.
The most useful benchmark is not the average. It is the gap between median and top quartile. If you are at median, the top quartile is reachable. If you are below median, the list or the copy is the problem, not the channel.
Quick overview
Cold email benchmarks in 2026 sit at: 38% median open rate, 2.1% median reply rate, 0.6% positive reply rate, and 0.35% booked demo rate. Top quartile lifts every number by 1.4x to 2.5x. The single biggest non-tool driver is list quality.
The 4 numbers that matter:
Open rate: 38% median, 52% top quartile
Reply rate: 2.1% median, 4.8% top quartile
Positive reply rate: 0.6% median, 1.6% top quartile
Booked demo rate: 0.35% median, 0.9% top quartile
Source: GROU 47-client benchmark + Smartlead 2025. Numbers are medians on warmed sending infrastructure and ICP-matched lists, 2024-2026.
The 4 metrics that actually matter
Most cold email reports track 8 to 12 metrics. The 4 below explain 95% of campaign outcomes. Track these, ignore the rest.
Open rate is the percentage of sends that get opened. Median: 38%. Useful for spotting subject line or deliverability issues. Less useful since iOS 15 Mail Privacy Protection inflates Apple Mail opens by 8-12%. Track the trend, not the absolute.
Reply rate is the percentage of sends that get any reply. Median: 2.1%. The most reliable cold email metric in 2026 because it cannot be inflated by automated prefetch. If reply rate is below 1%, the list is usually the problem.
Positive reply rate is the percentage of sends that get a reply expressing interest or asking a real question. Median: 0.6%. The metric that matters for pipeline. A 5% reply rate with 0.1% positive replies is worse than a 2% reply rate with 0.8% positive replies.
Booked demo rate is the percentage of sends that result in a calendar booking. Median: 0.35%. The final-stage metric. If booked demos drop below 0.2% but positive replies are healthy, the bottleneck is in the meeting-booking workflow, not the cold email.
Open rate benchmarks
Open rate varies materially by industry, sender setup, and time of week. The 2026 medians:
B2B SaaS: 42% median, 56% top quartile
Agencies / services: 39% median, 51% top quartile
Dev tools / infra: 36% median, 49% top quartile
E-commerce / DTC: 31% median, 44% top quartile
Healthcare / regulated: 28% median, 41% top quartile
Manufacturing / industrial: 33% median, 45% top quartile
The biggest deliverability levers per Smartlead's 2025 deliverability guide: separate sending domain, 2-week warmup, SPF/DKIM/DMARC authentication, 25-30 emails per inbox per day max, and 3 inboxes per domain.
Reply rate benchmarks by ACV
Reply rate scales inversely with ACV up to a point. Sub-$5k ACV pulls higher reply rates because the ask is smaller. Enterprise ACV pulls lower reply rates but each reply is worth more.
Under $2k ACV: 3.4% median, 6.2% top quartile
$2k-$10k ACV: 2.6% median, 4.8% top quartile
$10k-$50k ACV: 2.1% median, 4.1% top quartile
$50k-$100k ACV: 1.6% median, 3.4% top quartile
$100k+ ACV: 1.1% median, 2.6% top quartile
The implication for pipeline math: a $100k ACV campaign needs 3x the list volume of a $5k ACV campaign to produce the same number of replies. Source: GROU 47-client ACV-segmented data, 2024-2026.
Positive reply + booked demo by persona
Positive reply rate and booked demo rate vary heavily by buyer persona. The 2026 medians:
CMO / Head of Marketing: 0.9% positive reply, 0.52% booked demo
VP Sales / CRO: 0.8% positive reply, 0.48% booked demo
CTO / VP Engineering: 0.4% positive reply, 0.22% booked demo
Founder / CEO (sub-50 employees): 1.1% positive reply, 0.65% booked demo
Ops / Procurement: 0.6% positive reply, 0.31% booked demo
HR / People Ops: 0.7% positive reply, 0.38% booked demo
CTOs pull the lowest because they filter aggressively for technical specificity. See the how to email a CTO playbook for the CTO-specific tactics that close the gap. Founder-CEOs pull the highest because peer-to-peer outreach lifts every metric.
Benchmarks by sequence touch
A 4-touch sequence over 14 days is the 2026 standard. Reply rate per touch declines, but cumulative reply rate plateaus at touch 4. Past touch 4, complaint rate climbs above 0.4% which is enough to drop sender reputation per Google's bulk sender requirements.
Touch 1 (day 0): 1.9% reply rate. Highest per-touch reply rate. 40% of all replies come on touch 1.
Touch 2 (day 3): 1.4% reply rate. The follow-up bump. 30% of replies.
Touch 3 (day 7): 1.0% reply rate. Value-add or case study. 20% of replies.
Touch 4 (day 14): 0.6% reply rate. Breakup. 10% of replies.
Cumulative reply rate after touch 4: 4.9% (vs 1.9% if you stop at touch 1). Reading the math: stopping after touch 1 leaves 60% of replies on the table.
Top quartile vs median vs bottom quartile
The 2026 reality: median performance is mediocre, top quartile is achievable, bottom quartile is mostly fixable. The gap between bottom and median is bigger than between median and top.
Open rate: bottom 24%, median 38%, top 52%
Reply rate: bottom 0.8%, median 2.1%, top 4.8%
Positive reply rate: bottom 0.2%, median 0.6%, top 1.6%
Booked demo rate: bottom 0.1%, median 0.35%, top 0.9%
If you are bottom quartile, the fixes are deterministic: fix deliverability (separate domain + warmup), narrow the ICP, rewrite the cold open as a question not a pitch. See the cold email templates that work playbook for the templates that pull top-quartile reply rates.
If you are median, the lift to top quartile requires more nuanced work: persona-fit on subject lines (see the cold email subject lines library), trigger-based outbound, and quality lift on personalization.
How to improve below-benchmark campaigns
The fastest fixes ranked by impact across our 47-client benchmark:
1. Fix deliverability (-3 to -8pp on open rate). Move to a separate sending domain. Set up SPF, DKIM, DMARC. Warm up for 2 weeks. Cap each inbox at 25-30 emails per day. Most below-benchmark campaigns are deliverability problems first, copy problems second.
2. Narrow the ICP (-1 to -3pp on reply rate). If your ICP is over 5,000 accounts globally, you cannot maintain personalization quality. Narrow to under 5,000 with trigger filters: hiring, funding, leadership change, tech stack signals.
3. Rewrite the cold open as a question (-0.8 to -2.0pp on reply rate). Most cold opens pitch in sentence 1. Replace with a specific observation + a question. See the cold email templates that work library, templates 1-8.
4. Shorten subject lines to 3-5 words (-3 to -6pp on open rate). Subjects over 6 words drop open rate. Lowercase, internal-email feel. See the cold email subject lines guide.
5. Run a 4-touch sequence (-1.5 to -3.0pp on reply rate). Most operators stop at 1 touch. 60% of replies come on touches 2-4.
Tool recommendations for benchmark-grade campaigns
The benchmarks above run on any sender, but some tools materially help:
Smartlead ($39/month): the best for benchmark-grade deliverability. Inbox rotation + warmup. Read the Smartlead vs Instantly comparison.
Apollo ($59/month): the best for benchmark-grade list quality at scale. Read the full Apollo review.
Lemlist ($59/month): the best when you want video personalization or LinkedIn in the same sequence.
For the full deliverability + infra stack we deploy on every founder engagement, see cold email for SaaS founders and best cold email tools 2026.
Frequently asked questions
What is a good cold email open rate in 2026?
A good cold email open rate in 2026 is 38% median and 52% top quartile. Below 24% indicates a deliverability problem (sender domain, warmup, or authentication). Above 52% usually requires persona-specific subject lines and warm-network references.
What is a good cold email reply rate in 2026?
A good cold email reply rate in 2026 is 2.1% median and 4.8% top quartile. Below 1% indicates a list problem (ICP too broad or not matched to the campaign). 5%+ requires founder-led sending, referral campaigns, or trigger-based outbound.
How do you calculate cold email benchmarks?
Cold email benchmarks should be calculated on warmed sending infrastructure (separate domain, 2-week warmup, SPF/DKIM/DMARC) and ICP-matched lists. Measure: open rate, reply rate, positive reply rate, booked demo rate. Open rate is unreliable since iOS 15 Mail Privacy Protection — track the trend, not the absolute number.
What is a good cold email reply rate by industry?
B2B SaaS pulls 2.4% median reply rate. Agencies pull 2.0%. Dev tools pull 1.7%. E-commerce/DTC pulls 1.5%. Healthcare pulls 1.2%. Industry matters less than ICP narrowness and persona-fit.
What is the difference between reply rate and positive reply rate?
Reply rate is the percentage of sends that get any reply, including "unsubscribe", "not interested", or "wrong person". Positive reply rate is the subset that expresses interest, asks a real question, or wants a meeting. A 5% reply rate with 0.1% positive replies is worse than a 2% reply rate with 0.8% positive replies.
How long should it take to reach cold email benchmarks?
Reaching benchmark performance takes 6 to 10 weeks: 2 weeks of warmup, 2 weeks of copy and subject iteration, 2-4 weeks of optimizing list and sequence. Top-quartile performance takes 3-6 months of A/B testing across personas, subject lines, and sequence patterns.
What is the typical cost per booked demo from cold email?
Cost per booked demo from cold email ranges from $40 to $120 all-in (tools, list, sender time). Compared to paid ads at $250-$800 cost per demo for the same ICP, cold email is 3-8x cheaper at scale. Source: GROU 47-client cost benchmark, 2024-2026.
How do iOS 15 Mail Privacy Protection updates affect cold email benchmarks?
iOS 15 Mail Privacy Protection inflates Apple Mail open rates by 8-12% because Apple prefetches images including the tracking pixel. The implication for benchmarks: open rate is less reliable than it was pre-2022. Track reply rate as the primary metric.
What cold email reply rate should B2B SaaS founders target?
B2B SaaS founders running founder-led cold email should target 3-5% reply rate on the cold open. Founder-led outreach pulls 2.3x the reply rate of SDR-sent emails on identical lists. See the cold email for SaaS founders playbook.
Are cold email benchmarks the same for EU and US campaigns?
Cold email benchmarks for the EU are 0.4-0.8 percentage points lower across open rate and reply rate due to GDPR-driven shorter lists and stricter unsubscribe enforcement. The benchmark math itself is the same; the list size required is larger. See the GDPR cold email playbook.
How often should you re-benchmark cold email campaigns?
Re-benchmark cold email campaigns monthly for high-volume senders (5,000+ emails/month) and quarterly for lower-volume senders. Open rates decline 8-12% per month as subject lines get pattern-matched. Reply rates decline more slowly.
What is the worst cold email benchmark mistake?
Tracking only open rate. Open rate is the most inflated and least reliable metric in 2026. Operators who optimize for open rate often degrade reply rate by switching to clickbait subject lines that get opened but burn the reader. Track reply rate as the primary metric.
About GROU. GROU runs B2B pipeline for SaaS startups, agencies, and dev shops out of Colombia, Mexico, and Argentina. Since 2022 we have managed cold email for 47 B2B clients across 12,000+ campaign sends per month. Every benchmark in this article comes from our live client data anonymized and aggregated, cross-checked against public benchmarks from Smartlead, Apollo, and Lemlist. Methodology: medians and quartile splits computed on warmed sending infrastructure and ICP-matched lists, 2024-2026. If you want help applying these benchmarks to your campaigns, book a call.
This article contains affiliate links to Smartlead, Apollo, and Lemlist. We earn a small commission if you sign up, at no extra cost. We only recommend tools we deploy on live client campaigns.
Every cold email operator wants the same answer: is my campaign performing? This is the 2026 benchmark guide we use at GROU to answer that question for 47 B2B clients. The numbers below come from our 12,000+ campaign sends per month, cross-checked against the Smartlead 2025 benchmark report, Apollo's 2025 persona benchmark, and the Lemlist State of Cold Email 2025.
The most useful benchmark is not the average. It is the gap between median and top quartile. If you are at median, the top quartile is reachable. If you are below median, the list or the copy is the problem, not the channel.
Quick overview
Cold email benchmarks in 2026 sit at: 38% median open rate, 2.1% median reply rate, 0.6% positive reply rate, and 0.35% booked demo rate. Top quartile lifts every number by 1.4x to 2.5x. The single biggest non-tool driver is list quality.
The 4 numbers that matter:
Open rate: 38% median, 52% top quartile
Reply rate: 2.1% median, 4.8% top quartile
Positive reply rate: 0.6% median, 1.6% top quartile
Booked demo rate: 0.35% median, 0.9% top quartile
Source: GROU 47-client benchmark + Smartlead 2025. Numbers are medians on warmed sending infrastructure and ICP-matched lists, 2024-2026.
The 4 metrics that actually matter
Most cold email reports track 8 to 12 metrics. The 4 below explain 95% of campaign outcomes. Track these, ignore the rest.
Open rate is the percentage of sends that get opened. Median: 38%. Useful for spotting subject line or deliverability issues. Less useful since iOS 15 Mail Privacy Protection inflates Apple Mail opens by 8-12%. Track the trend, not the absolute.
Reply rate is the percentage of sends that get any reply. Median: 2.1%. The most reliable cold email metric in 2026 because it cannot be inflated by automated prefetch. If reply rate is below 1%, the list is usually the problem.
Positive reply rate is the percentage of sends that get a reply expressing interest or asking a real question. Median: 0.6%. The metric that matters for pipeline. A 5% reply rate with 0.1% positive replies is worse than a 2% reply rate with 0.8% positive replies.
Booked demo rate is the percentage of sends that result in a calendar booking. Median: 0.35%. The final-stage metric. If booked demos drop below 0.2% but positive replies are healthy, the bottleneck is in the meeting-booking workflow, not the cold email.
Open rate benchmarks
Open rate varies materially by industry, sender setup, and time of week. The 2026 medians:
B2B SaaS: 42% median, 56% top quartile
Agencies / services: 39% median, 51% top quartile
Dev tools / infra: 36% median, 49% top quartile
E-commerce / DTC: 31% median, 44% top quartile
Healthcare / regulated: 28% median, 41% top quartile
Manufacturing / industrial: 33% median, 45% top quartile
The biggest deliverability levers per Smartlead's 2025 deliverability guide: separate sending domain, 2-week warmup, SPF/DKIM/DMARC authentication, 25-30 emails per inbox per day max, and 3 inboxes per domain.
Reply rate benchmarks by ACV
Reply rate scales inversely with ACV up to a point. Sub-$5k ACV pulls higher reply rates because the ask is smaller. Enterprise ACV pulls lower reply rates but each reply is worth more.
Under $2k ACV: 3.4% median, 6.2% top quartile
$2k-$10k ACV: 2.6% median, 4.8% top quartile
$10k-$50k ACV: 2.1% median, 4.1% top quartile
$50k-$100k ACV: 1.6% median, 3.4% top quartile
$100k+ ACV: 1.1% median, 2.6% top quartile
The implication for pipeline math: a $100k ACV campaign needs 3x the list volume of a $5k ACV campaign to produce the same number of replies. Source: GROU 47-client ACV-segmented data, 2024-2026.
Positive reply + booked demo by persona
Positive reply rate and booked demo rate vary heavily by buyer persona. The 2026 medians:
CMO / Head of Marketing: 0.9% positive reply, 0.52% booked demo
VP Sales / CRO: 0.8% positive reply, 0.48% booked demo
CTO / VP Engineering: 0.4% positive reply, 0.22% booked demo
Founder / CEO (sub-50 employees): 1.1% positive reply, 0.65% booked demo
Ops / Procurement: 0.6% positive reply, 0.31% booked demo
HR / People Ops: 0.7% positive reply, 0.38% booked demo
CTOs pull the lowest because they filter aggressively for technical specificity. See the how to email a CTO playbook for the CTO-specific tactics that close the gap. Founder-CEOs pull the highest because peer-to-peer outreach lifts every metric.
Benchmarks by sequence touch
A 4-touch sequence over 14 days is the 2026 standard. Reply rate per touch declines, but cumulative reply rate plateaus at touch 4. Past touch 4, complaint rate climbs above 0.4% which is enough to drop sender reputation per Google's bulk sender requirements.
Touch 1 (day 0): 1.9% reply rate. Highest per-touch reply rate. 40% of all replies come on touch 1.
Touch 2 (day 3): 1.4% reply rate. The follow-up bump. 30% of replies.
Touch 3 (day 7): 1.0% reply rate. Value-add or case study. 20% of replies.
Touch 4 (day 14): 0.6% reply rate. Breakup. 10% of replies.
Cumulative reply rate after touch 4: 4.9% (vs 1.9% if you stop at touch 1). Reading the math: stopping after touch 1 leaves 60% of replies on the table.
Top quartile vs median vs bottom quartile
The 2026 reality: median performance is mediocre, top quartile is achievable, bottom quartile is mostly fixable. The gap between bottom and median is bigger than between median and top.
Open rate: bottom 24%, median 38%, top 52%
Reply rate: bottom 0.8%, median 2.1%, top 4.8%
Positive reply rate: bottom 0.2%, median 0.6%, top 1.6%
Booked demo rate: bottom 0.1%, median 0.35%, top 0.9%
If you are bottom quartile, the fixes are deterministic: fix deliverability (separate domain + warmup), narrow the ICP, rewrite the cold open as a question not a pitch. See the cold email templates that work playbook for the templates that pull top-quartile reply rates.
If you are median, the lift to top quartile requires more nuanced work: persona-fit on subject lines (see the cold email subject lines library), trigger-based outbound, and quality lift on personalization.
How to improve below-benchmark campaigns
The fastest fixes ranked by impact across our 47-client benchmark:
1. Fix deliverability (-3 to -8pp on open rate). Move to a separate sending domain. Set up SPF, DKIM, DMARC. Warm up for 2 weeks. Cap each inbox at 25-30 emails per day. Most below-benchmark campaigns are deliverability problems first, copy problems second.
2. Narrow the ICP (-1 to -3pp on reply rate). If your ICP is over 5,000 accounts globally, you cannot maintain personalization quality. Narrow to under 5,000 with trigger filters: hiring, funding, leadership change, tech stack signals.
3. Rewrite the cold open as a question (-0.8 to -2.0pp on reply rate). Most cold opens pitch in sentence 1. Replace with a specific observation + a question. See the cold email templates that work library, templates 1-8.
4. Shorten subject lines to 3-5 words (-3 to -6pp on open rate). Subjects over 6 words drop open rate. Lowercase, internal-email feel. See the cold email subject lines guide.
5. Run a 4-touch sequence (-1.5 to -3.0pp on reply rate). Most operators stop at 1 touch. 60% of replies come on touches 2-4.
Tool recommendations for benchmark-grade campaigns
The benchmarks above run on any sender, but some tools materially help:
Smartlead ($39/month): the best for benchmark-grade deliverability. Inbox rotation + warmup. Read the Smartlead vs Instantly comparison.
Apollo ($59/month): the best for benchmark-grade list quality at scale. Read the full Apollo review.
Lemlist ($59/month): the best when you want video personalization or LinkedIn in the same sequence.
For the full deliverability + infra stack we deploy on every founder engagement, see cold email for SaaS founders and best cold email tools 2026.
Frequently asked questions
What is a good cold email open rate in 2026?
A good cold email open rate in 2026 is 38% median and 52% top quartile. Below 24% indicates a deliverability problem (sender domain, warmup, or authentication). Above 52% usually requires persona-specific subject lines and warm-network references.
What is a good cold email reply rate in 2026?
A good cold email reply rate in 2026 is 2.1% median and 4.8% top quartile. Below 1% indicates a list problem (ICP too broad or not matched to the campaign). 5%+ requires founder-led sending, referral campaigns, or trigger-based outbound.
How do you calculate cold email benchmarks?
Cold email benchmarks should be calculated on warmed sending infrastructure (separate domain, 2-week warmup, SPF/DKIM/DMARC) and ICP-matched lists. Measure: open rate, reply rate, positive reply rate, booked demo rate. Open rate is unreliable since iOS 15 Mail Privacy Protection — track the trend, not the absolute number.
What is a good cold email reply rate by industry?
B2B SaaS pulls 2.4% median reply rate. Agencies pull 2.0%. Dev tools pull 1.7%. E-commerce/DTC pulls 1.5%. Healthcare pulls 1.2%. Industry matters less than ICP narrowness and persona-fit.
What is the difference between reply rate and positive reply rate?
Reply rate is the percentage of sends that get any reply, including "unsubscribe", "not interested", or "wrong person". Positive reply rate is the subset that expresses interest, asks a real question, or wants a meeting. A 5% reply rate with 0.1% positive replies is worse than a 2% reply rate with 0.8% positive replies.
How long should it take to reach cold email benchmarks?
Reaching benchmark performance takes 6 to 10 weeks: 2 weeks of warmup, 2 weeks of copy and subject iteration, 2-4 weeks of optimizing list and sequence. Top-quartile performance takes 3-6 months of A/B testing across personas, subject lines, and sequence patterns.
What is the typical cost per booked demo from cold email?
Cost per booked demo from cold email ranges from $40 to $120 all-in (tools, list, sender time). Compared to paid ads at $250-$800 cost per demo for the same ICP, cold email is 3-8x cheaper at scale. Source: GROU 47-client cost benchmark, 2024-2026.
How do iOS 15 Mail Privacy Protection updates affect cold email benchmarks?
iOS 15 Mail Privacy Protection inflates Apple Mail open rates by 8-12% because Apple prefetches images including the tracking pixel. The implication for benchmarks: open rate is less reliable than it was pre-2022. Track reply rate as the primary metric.
What cold email reply rate should B2B SaaS founders target?
B2B SaaS founders running founder-led cold email should target 3-5% reply rate on the cold open. Founder-led outreach pulls 2.3x the reply rate of SDR-sent emails on identical lists. See the cold email for SaaS founders playbook.
Are cold email benchmarks the same for EU and US campaigns?
Cold email benchmarks for the EU are 0.4-0.8 percentage points lower across open rate and reply rate due to GDPR-driven shorter lists and stricter unsubscribe enforcement. The benchmark math itself is the same; the list size required is larger. See the GDPR cold email playbook.
How often should you re-benchmark cold email campaigns?
Re-benchmark cold email campaigns monthly for high-volume senders (5,000+ emails/month) and quarterly for lower-volume senders. Open rates decline 8-12% per month as subject lines get pattern-matched. Reply rates decline more slowly.
What is the worst cold email benchmark mistake?
Tracking only open rate. Open rate is the most inflated and least reliable metric in 2026. Operators who optimize for open rate often degrade reply rate by switching to clickbait subject lines that get opened but burn the reader. Track reply rate as the primary metric.
About GROU. GROU runs B2B pipeline for SaaS startups, agencies, and dev shops out of Colombia, Mexico, and Argentina. Since 2022 we have managed cold email for 47 B2B clients across 12,000+ campaign sends per month. Every benchmark in this article comes from our live client data anonymized and aggregated, cross-checked against public benchmarks from Smartlead, Apollo, and Lemlist. Methodology: medians and quartile splits computed on warmed sending infrastructure and ICP-matched lists, 2024-2026. If you want help applying these benchmarks to your campaigns, book a call.
This article contains affiliate links to Smartlead, Apollo, and Lemlist. We earn a small commission if you sign up, at no extra cost. We only recommend tools we deploy on live client campaigns.

Pipeline OS Newsletter
Build qualified pipeline
Get weekly tactics to generate demand, improve lead quality, and book more meetings.





Trusted by industry leaders
Trusted by industry leaders
Trusted by industry leaders
Ready to build qualified pipeline?
Ready to build qualified pipeline?
Ready to build qualified pipeline?
Book a call to see if we're the right fit, or take the 2-minute quiz to get a clear starting point.
Book a call to see if we're the right fit, or take the 2-minute quiz to get a clear starting point.
Book a call to see if we're the right fit, or take the 2-minute quiz to get a clear starting point.
" height="30.21639343089746px" id="hfGbXmQR2" width="30.216393430897455px"/></svg>)
Copyright © 2026 – All Right Reserved
Copyright © 2026 – All Right Reserved
Copyright © 2026 – All Right Reserved