%22%3E%3C/path%3E%3Cpath d=%22M 63.072 7.554 C 62.258 8.022 61.577 8.689 61.092 9.493 L 61.092 7.076 L 57.158 7.076 L 57.158 22.64 L 61.089 22.64 L 61.089 14.888 C 61.089 13.446 61.403 12.434 62.03 11.853 C 62.818 11.218 63.818 10.907 64.826 10.982 L 65.868 10.982 L 65.868 6.851 C 64.891 6.834 63.926 7.076 63.073 7.554 Z%22 fill=%22rgb(17,17,17)%22%3E%3C/path%3E%3Cpath d=%22M 78.916 7.82 C 76.363 6.49 73.321 6.49 70.768 7.82 C 69.562 8.473 68.564 9.451 67.888 10.644 C 67.167 11.931 66.803 13.387 66.834 14.862 C 66.804 16.332 67.157 17.785 67.86 19.077 C 68.515 20.267 69.494 21.246 70.684 21.901 C 71.924 22.576 73.318 22.92 74.73 22.898 C 76.164 22.918 77.58 22.575 78.846 21.901 C 80.062 21.247 81.073 20.27 81.768 19.077 C 82.506 17.797 82.88 16.339 82.85 14.862 C 82.88 13.389 82.517 11.934 81.797 10.647 C 81.12 9.455 80.122 8.477 78.917 7.824 M 78.803 14.862 C 78.829 15.739 78.636 16.608 78.241 17.391 C 77.903 18.046 77.38 18.588 76.738 18.95 C 76.124 19.293 75.432 19.472 74.729 19.47 C 73.668 19.497 72.648 19.061 71.934 18.276 C 71.139 17.323 70.741 16.1 70.823 14.862 C 70.741 13.62 71.149 12.395 71.959 11.45 C 72.687 10.667 73.715 10.233 74.783 10.256 C 75.859 10.236 76.894 10.67 77.635 11.45 C 78.464 12.387 78.884 13.616 78.801 14.864%22 fill=%22rgb(17,17,17)%22%3E%3C/path%3E%3Cpath d=%22M 95.906 7.076 L 95.906 15.646 C 95.975 16.68 95.643 17.701 94.979 18.498 C 94.311 19.184 93.379 19.547 92.422 19.495 C 91.475 19.544 90.553 19.18 89.894 18.498 C 89.23 17.701 88.898 16.68 88.967 15.646 L 88.967 7.076 L 85.033 7.076 L 85.033 16.207 C 85 17.449 85.275 18.68 85.834 19.79 C 86.327 20.75 87.095 21.542 88.039 22.065 C 89.033 22.594 90.145 22.861 91.271 22.838 C 92.188 22.847 93.095 22.65 93.926 22.263 C 94.708 21.905 95.388 21.36 95.906 20.675 L 95.906 22.645 L 99.865 22.645 L 99.865 7.076 Z%22 fill=%22rgb(17,17,17)%22%3E%3C/path%3E%3Cpath d=%22M 4.513 15.626 C 4.511 10.815 7.606 6.549 12.181 5.059 C 16.756 3.57 21.77 5.195 24.601 9.086 L 27.816 5.87 C 24.074 1.186 17.981 -0.943 12.137 0.393 C 6.292 1.728 1.728 6.292 0.393 12.137 C -0.943 17.981 1.186 24.074 5.87 27.816 L 9.085 24.601 C 6.214 22.512 4.515 19.177 4.513 15.626%22 fill=%22rgb(32,62,235)%22%3E%3C/path%3E%3Cpath d=%22M 17.114 14.343 L 13.354 18.01 L 13.354 18.026 L 21.071 18.026 L 11.412 27.609 L 17.389 27.609 L 23.999 21.081 L 23.999 28.316 L 24.005 28.316 L 27.967 24.393 L 27.967 14.343 Z%22 fill=%22rgb(32,62,235)%22%3E%3C/path%3E%3C/g%3E%3C/svg%3E) ×
× ××
××›
›
›
›
MQL to SQL conversion benchmarks 2026 by industry, channel
MQL to SQL conversion benchmarks 2026 by industry, channel
MQL to SQL conversion benchmarks 2026 by industry, channel
MQL to SQL conversion benchmarks 2026 by industry, channel
MQL to SQL conversion benchmarks 2026 by industry, channel
MQL to SQL conversion benchmarks 2026 by industry, channel

Author
Aljaz Peklaj

The cross-industry MQL to SQL conversion rate sits around 13% in 2026, B2B SaaS averages 18-22%, and top-quartile teams convert 25-35%. The spread by channel is even wider: organic search MQLs convert at 45-51% while outbound-sourced MQLs land at 8-15%. If your rate looks bad, the first suspect is usually your MQL definition, not your sales team.
Here are the benchmarks by industry, channel, and deal size, plus the diagnostic we run before touching anything else in the funnel.
TL;DR
Benchmark yourself against segment, not the global average: 13% cross-industry, 18-22% for B2B SaaS, 25-35% for top-quartile SaaS teams, with MarTech (20-28%) and vertical SaaS (22-30%) running hottest. Channel decides more than industry: organic search (45-51%), referral (40-50%), and email nurture (40-46%) MQLs convert at 3-5x the rate of paid social (10-18%) and outbound-sourced (8-15%) MQLs. Deal size pulls the number down as ACV climbs, from 25-35% under $5K to 8-15% at enterprise. A healthy B2B funnel converts MQL to SQL above 15% within 30 days of the MQL trigger; below 10%, fix the definition and routing before blaming sales.
Related benchmarks: B2B SaaS pipeline benchmarks and CAC payback benchmarks.
The 2026 benchmarks by segment
Averages hide more than they show here, because "MQL" means different things in different motions. Anchor on your segment and quartile, and treat the global 13% as the floor for a functioning funnel, not the target.
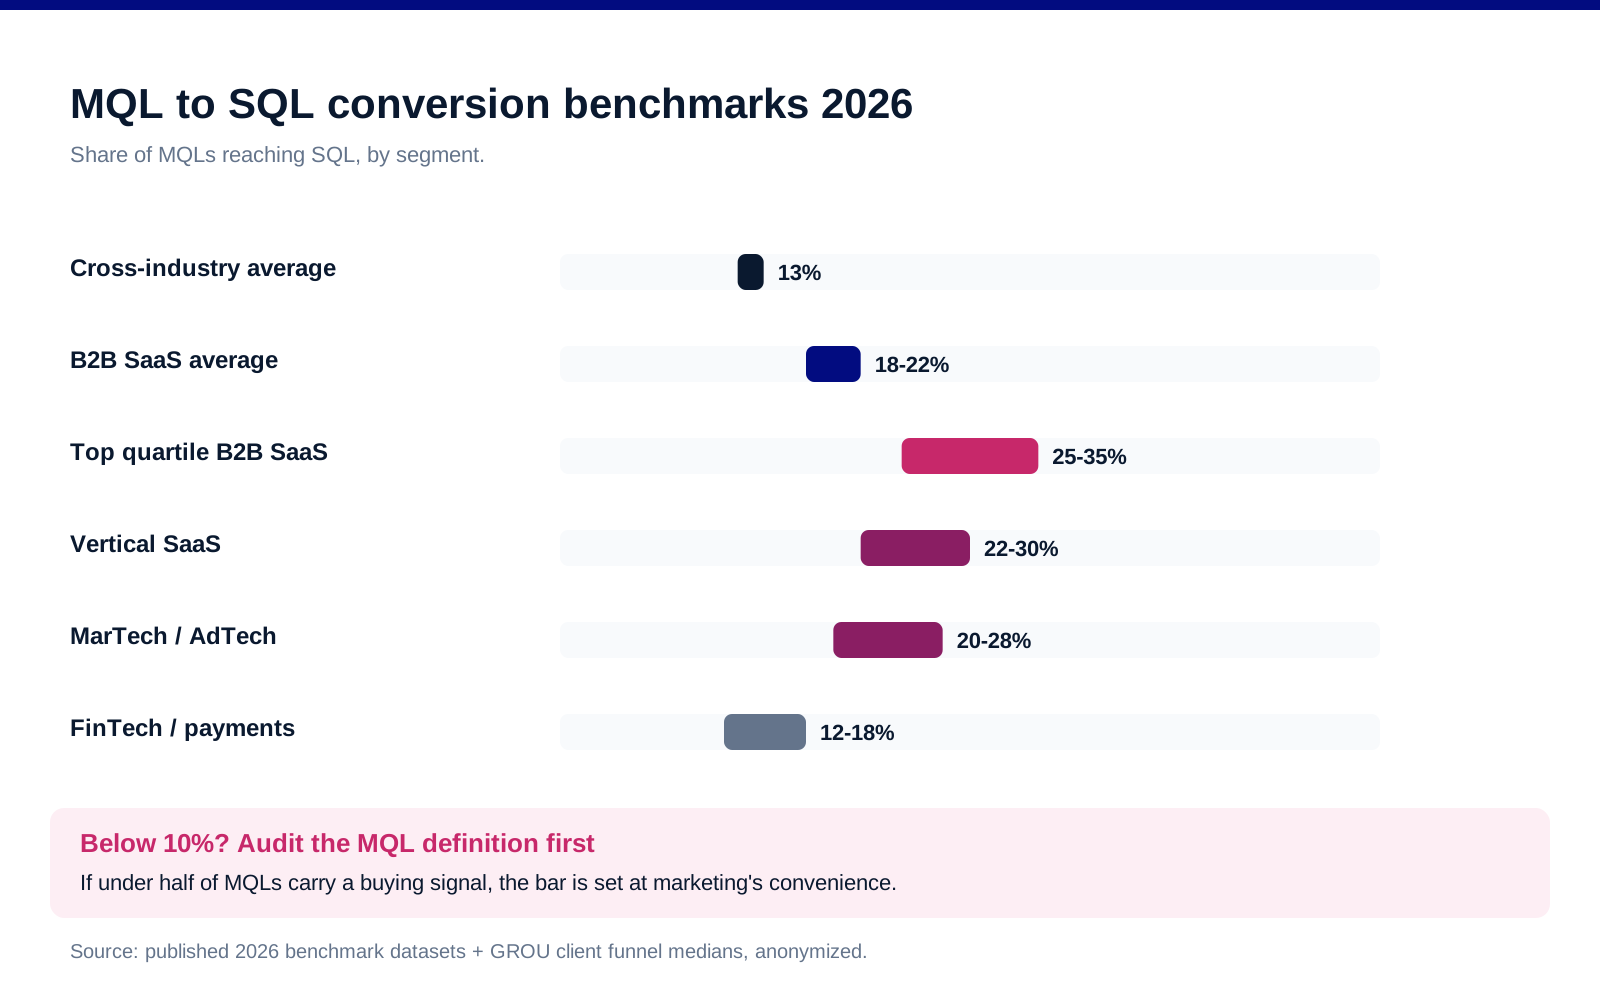
Cross-industry average: ~13%. The number most published datasets converge on. Below 10%, the funnel is leaking at definition or routing.
B2B SaaS average: 18-22%. Product-led and mid-market SaaS motions qualify harder at the MQL stage, which lifts the conversion.
Top quartile B2B SaaS: 25-35%. These teams share two habits: scoring thresholds tied to buying signals, not content downloads, and same-day routing.
By vertical: vertical SaaS (22-30%) and MarTech (20-28%) convert best because buyers self-select tightly; FinTech (12-18%) and HR tech (15-20%) sit lower under committee-heavy buying. Forrester's buying research puts the average B2B buying committee at 13 stakeholders, and every added stakeholder taxes this stage.
Conversion by channel: the real driver
Channel source predicts MQL quality better than any scoring model we have deployed. The gap between the best and worst channel is roughly 5x, which is why blended averages mislead.
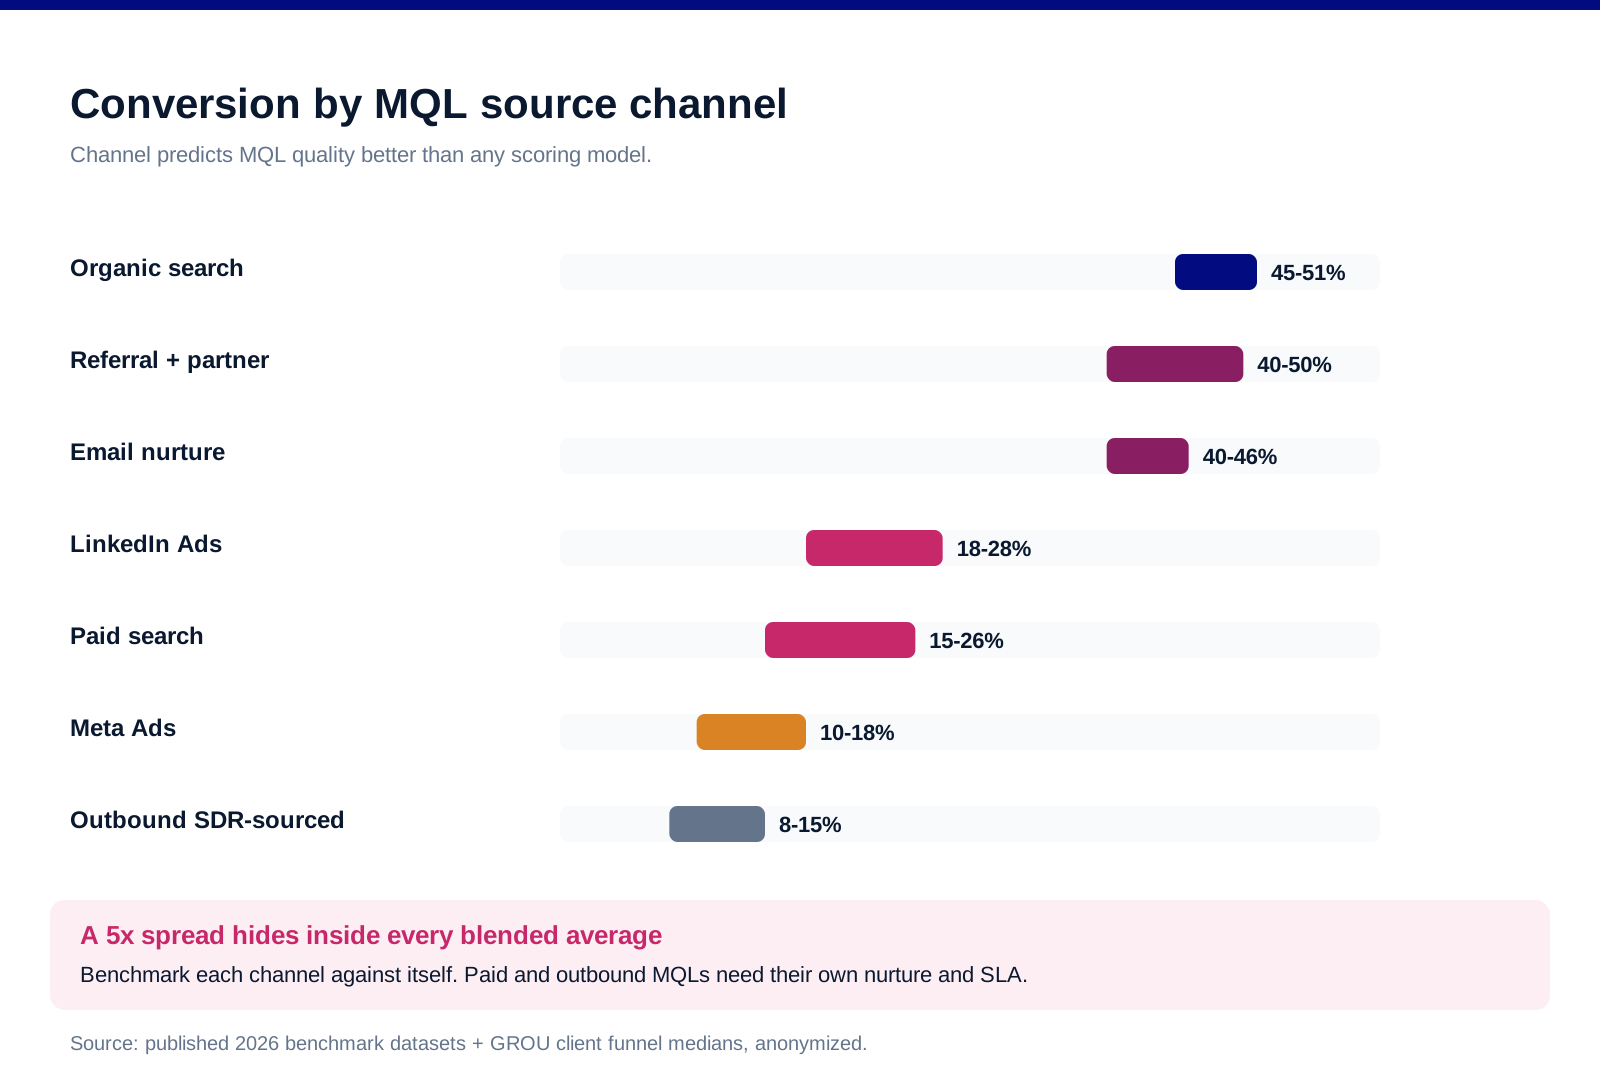
Organic search: 45-51%. The buyer arrived with the problem already named. Highest-intent MQL source in every dataset we have seen, which is half the argument for the content flywheel in our B2B content marketing strategy.
Referral and partner: 40-50%. Borrowed trust converts almost as well as organic intent.
Email nurture: 40-46%. Slow, cheap, compounding. The nurture-to-MQL bar is naturally high because the lead has survived a sequence.
LinkedIn Ads: 18-28% and paid search: 15-26%. Solid mid-tier when targeting is tight; collapses when lead-gen forms harvest low-commitment downloads.
Meta Ads: 10-18% and outbound SDR-sourced: 8-15%. Not failure, physics: these channels interrupt rather than capture demand. Their MQLs need different nurture and different SLAs, and per Gartner's B2B buying research, buyers spend only about 5% of the journey with any sales rep, so interrupted buyers take longer to ripen.
Deal size gravity, and how to diagnose your own rate
Bigger deals convert slower at every stage, and MQL to SQL is where it shows first. Benchmarks by ACV band: 25-35% under $5K, 18-25% at $5-25K, 12-20% at $25-100K, 8-15% at enterprise ACV.
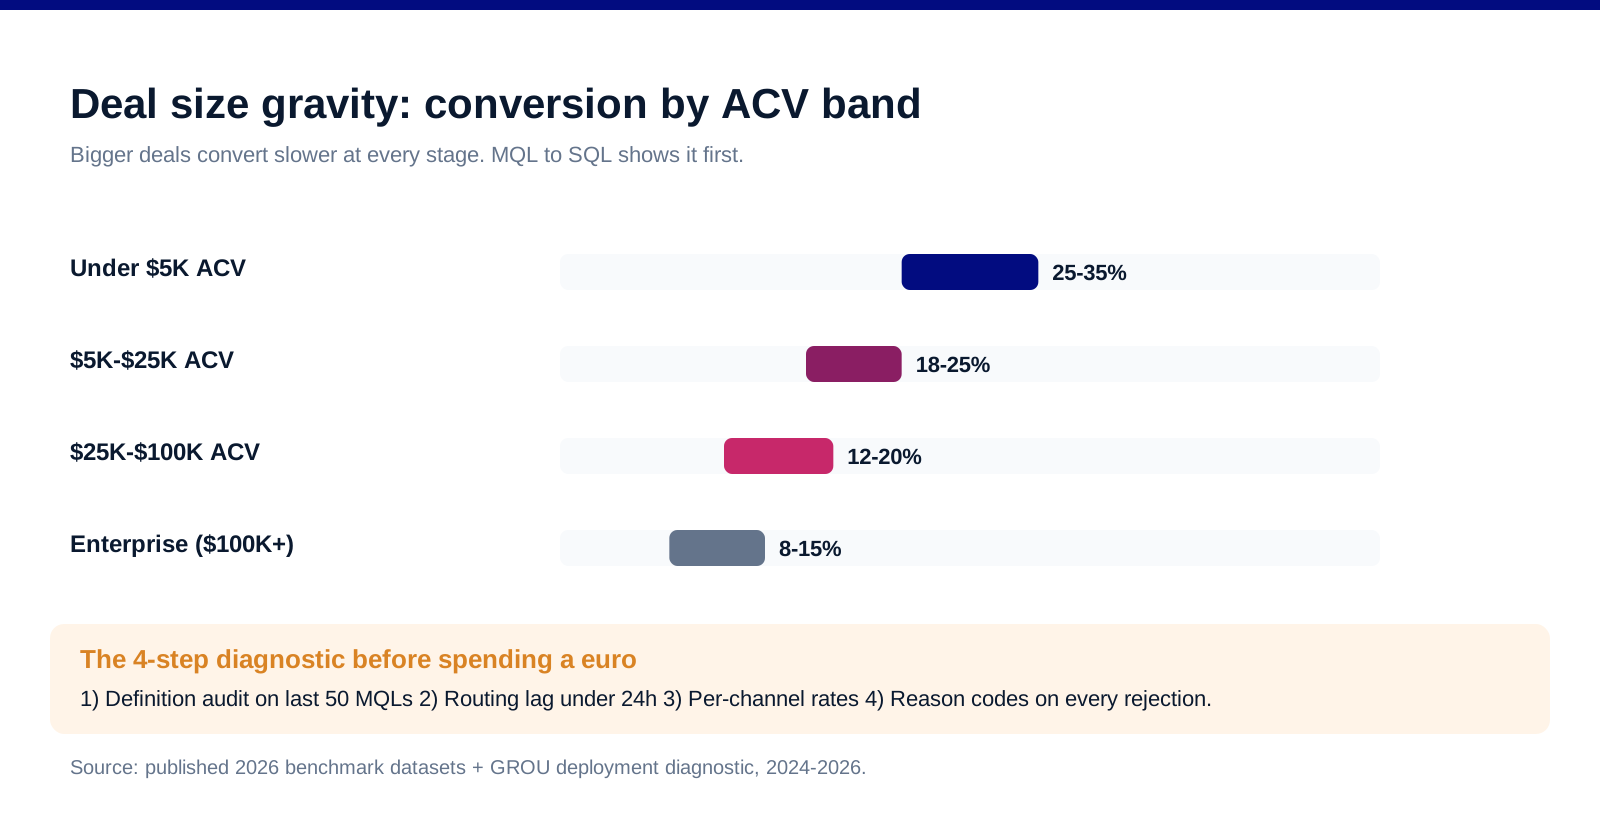
The diagnostic, in order:
1. Definition audit. List the last 50 MQLs and mark which had a buying signal (pricing page, demo request, trial, competitor comparison) versus a content signal (ebook, webinar registration). If under half carry buying signals, the MQL bar is set at marketing's convenience, not sales reality. Our lead scoring template sets the thresholds.
2. Routing lag. Measure trigger-to-first-touch time. Conversion decays sharply after 24 hours; same-day touch is the single cheapest lift available.
3. Channel mix shift. Recompute the rate per channel before judging the blend. A "falling" conversion rate is often just paid volume growing faster than organic.
4. SLA check. If sales can demote MQLs without a reason code, the data is unusable. Add reason codes first, benchmark second.
The mistakes that flatter or sink the metric
Mistake 1: inflating MQL volume for the marketing report. Every low-intent MQL added to hit a volume target dilutes the conversion rate sales gets judged on. One number must own the handoff.
Mistake 2: benchmarking the blend against SaaS averages. A funnel that is 70% paid social should expect 12-16%, not 22%. Compare like channel mix to like.
Mistake 3: no time-boxing. An MQL that converts in month 6 is a different object from one converting in week 1. Report conversion inside 30, 60, and 90-day windows or trends are unreadable.
Mistake 4: fixing sales when the problem is scoring. If SQL-to-opportunity conversion is healthy but MQL-to-SQL is low, the leak is upstream in definition and routing, not in the SDR seat, as the stage-by-stage view in our sales pipeline stages guide shows.
FAQ
What is a good MQL to SQL conversion rate in 2026?
Above 13% is functional cross-industry, 18-22% is the B2B SaaS average, and 25%+ puts you in the top quartile. Judge the number against your channel mix and ACV band: 15% on an outbound-heavy funnel is strong, while 15% on an organic-heavy funnel is a definition problem.
Why is my MQL to SQL conversion rate so low?
Three causes in order of frequency: the MQL definition rewards content engagement instead of buying signals, routing takes longer than 24 hours, or the channel mix shifted toward paid and outbound sources without resetting expectations. Audit the last 50 MQLs before changing anything else.
What conversion rate should outbound-sourced MQLs hit?
8-15%. Outbound interrupts demand rather than capturing it, so its MQLs ripen slower. Give outbound-sourced leads their own nurture track and their own benchmark instead of blending them with inbound.
How fast should an MQL be routed to sales?
Same day, with the first touch inside 24 hours of the trigger. Conversion decays sharply with routing lag, and speed-to-lead is the cheapest lever on this list: no new budget, no new tooling, just an SLA.
What percentage of SQLs should become opportunities?
Healthy B2B funnels convert roughly 50-60% of SQLs to opportunities. If that stage is strong while MQL to SQL is weak, the leak is upstream in scoring and routing. If both are weak, revisit the ICP itself.
How do I measure MQL to SQL conversion correctly?
Time-box it: report the share of MQLs that reach SQL within 30, 60, and 90 days of the MQL trigger, split by source channel. Require a reason code on every rejected MQL. Blended, untimed, unattributed rates are the reason most teams cannot act on this metric.
Bottom line
The benchmark that matters is segment-, channel-, and ACV-adjusted: 13% cross-industry, 18-22% B2B SaaS, 45%+ from organic, 8-15% from outbound. Before spending a euro to move the number, run the four-step diagnostic: definition audit, routing lag, channel mix, SLA. In our deployment experience the definition audit alone explains most "conversion crises", and same-day routing is the fastest lift.
Want the scoring, routing, and reporting built properly? Book a call with GROU. We build lead qualification systems inside B2B revenue engines across verticals from SaaS to manufacturing.
We are GROU, a B2B pipeline agency that runs lead generation, outbound, and LinkedIn content for clients across manufacturing, fintech, iGaming, software, and professional services. Benchmark ranges combine published 2026 conversion datasets with weighted medians from our client funnel deployments, anonymized to protect confidentiality.
Some links in this article are affiliate. We may earn a small commission at no extra cost to you. We only recommend tools we've deployed for clients.
The cross-industry MQL to SQL conversion rate sits around 13% in 2026, B2B SaaS averages 18-22%, and top-quartile teams convert 25-35%. The spread by channel is even wider: organic search MQLs convert at 45-51% while outbound-sourced MQLs land at 8-15%. If your rate looks bad, the first suspect is usually your MQL definition, not your sales team.
Here are the benchmarks by industry, channel, and deal size, plus the diagnostic we run before touching anything else in the funnel.
TL;DR
Benchmark yourself against segment, not the global average: 13% cross-industry, 18-22% for B2B SaaS, 25-35% for top-quartile SaaS teams, with MarTech (20-28%) and vertical SaaS (22-30%) running hottest. Channel decides more than industry: organic search (45-51%), referral (40-50%), and email nurture (40-46%) MQLs convert at 3-5x the rate of paid social (10-18%) and outbound-sourced (8-15%) MQLs. Deal size pulls the number down as ACV climbs, from 25-35% under $5K to 8-15% at enterprise. A healthy B2B funnel converts MQL to SQL above 15% within 30 days of the MQL trigger; below 10%, fix the definition and routing before blaming sales.
Related benchmarks: B2B SaaS pipeline benchmarks and CAC payback benchmarks.
The 2026 benchmarks by segment
Averages hide more than they show here, because "MQL" means different things in different motions. Anchor on your segment and quartile, and treat the global 13% as the floor for a functioning funnel, not the target.
Cross-industry average: ~13%. The number most published datasets converge on. Below 10%, the funnel is leaking at definition or routing.
B2B SaaS average: 18-22%. Product-led and mid-market SaaS motions qualify harder at the MQL stage, which lifts the conversion.
Top quartile B2B SaaS: 25-35%. These teams share two habits: scoring thresholds tied to buying signals, not content downloads, and same-day routing.
By vertical: vertical SaaS (22-30%) and MarTech (20-28%) convert best because buyers self-select tightly; FinTech (12-18%) and HR tech (15-20%) sit lower under committee-heavy buying. Forrester's buying research puts the average B2B buying committee at 13 stakeholders, and every added stakeholder taxes this stage.
Conversion by channel: the real driver
Channel source predicts MQL quality better than any scoring model we have deployed. The gap between the best and worst channel is roughly 5x, which is why blended averages mislead.
Organic search: 45-51%. The buyer arrived with the problem already named. Highest-intent MQL source in every dataset we have seen, which is half the argument for the content flywheel in our B2B content marketing strategy.
Referral and partner: 40-50%. Borrowed trust converts almost as well as organic intent.
Email nurture: 40-46%. Slow, cheap, compounding. The nurture-to-MQL bar is naturally high because the lead has survived a sequence.
LinkedIn Ads: 18-28% and paid search: 15-26%. Solid mid-tier when targeting is tight; collapses when lead-gen forms harvest low-commitment downloads.
Meta Ads: 10-18% and outbound SDR-sourced: 8-15%. Not failure, physics: these channels interrupt rather than capture demand. Their MQLs need different nurture and different SLAs, and per Gartner's B2B buying research, buyers spend only about 5% of the journey with any sales rep, so interrupted buyers take longer to ripen.
Deal size gravity, and how to diagnose your own rate
Bigger deals convert slower at every stage, and MQL to SQL is where it shows first. Benchmarks by ACV band: 25-35% under $5K, 18-25% at $5-25K, 12-20% at $25-100K, 8-15% at enterprise ACV.
The diagnostic, in order:
1. Definition audit. List the last 50 MQLs and mark which had a buying signal (pricing page, demo request, trial, competitor comparison) versus a content signal (ebook, webinar registration). If under half carry buying signals, the MQL bar is set at marketing's convenience, not sales reality. Our lead scoring template sets the thresholds.
2. Routing lag. Measure trigger-to-first-touch time. Conversion decays sharply after 24 hours; same-day touch is the single cheapest lift available.
3. Channel mix shift. Recompute the rate per channel before judging the blend. A "falling" conversion rate is often just paid volume growing faster than organic.
4. SLA check. If sales can demote MQLs without a reason code, the data is unusable. Add reason codes first, benchmark second.
The mistakes that flatter or sink the metric
Mistake 1: inflating MQL volume for the marketing report. Every low-intent MQL added to hit a volume target dilutes the conversion rate sales gets judged on. One number must own the handoff.
Mistake 2: benchmarking the blend against SaaS averages. A funnel that is 70% paid social should expect 12-16%, not 22%. Compare like channel mix to like.
Mistake 3: no time-boxing. An MQL that converts in month 6 is a different object from one converting in week 1. Report conversion inside 30, 60, and 90-day windows or trends are unreadable.
Mistake 4: fixing sales when the problem is scoring. If SQL-to-opportunity conversion is healthy but MQL-to-SQL is low, the leak is upstream in definition and routing, not in the SDR seat, as the stage-by-stage view in our sales pipeline stages guide shows.
FAQ
What is a good MQL to SQL conversion rate in 2026?
Above 13% is functional cross-industry, 18-22% is the B2B SaaS average, and 25%+ puts you in the top quartile. Judge the number against your channel mix and ACV band: 15% on an outbound-heavy funnel is strong, while 15% on an organic-heavy funnel is a definition problem.
Why is my MQL to SQL conversion rate so low?
Three causes in order of frequency: the MQL definition rewards content engagement instead of buying signals, routing takes longer than 24 hours, or the channel mix shifted toward paid and outbound sources without resetting expectations. Audit the last 50 MQLs before changing anything else.
What conversion rate should outbound-sourced MQLs hit?
8-15%. Outbound interrupts demand rather than capturing it, so its MQLs ripen slower. Give outbound-sourced leads their own nurture track and their own benchmark instead of blending them with inbound.
How fast should an MQL be routed to sales?
Same day, with the first touch inside 24 hours of the trigger. Conversion decays sharply with routing lag, and speed-to-lead is the cheapest lever on this list: no new budget, no new tooling, just an SLA.
What percentage of SQLs should become opportunities?
Healthy B2B funnels convert roughly 50-60% of SQLs to opportunities. If that stage is strong while MQL to SQL is weak, the leak is upstream in scoring and routing. If both are weak, revisit the ICP itself.
How do I measure MQL to SQL conversion correctly?
Time-box it: report the share of MQLs that reach SQL within 30, 60, and 90 days of the MQL trigger, split by source channel. Require a reason code on every rejected MQL. Blended, untimed, unattributed rates are the reason most teams cannot act on this metric.
Bottom line
The benchmark that matters is segment-, channel-, and ACV-adjusted: 13% cross-industry, 18-22% B2B SaaS, 45%+ from organic, 8-15% from outbound. Before spending a euro to move the number, run the four-step diagnostic: definition audit, routing lag, channel mix, SLA. In our deployment experience the definition audit alone explains most "conversion crises", and same-day routing is the fastest lift.
Want the scoring, routing, and reporting built properly? Book a call with GROU. We build lead qualification systems inside B2B revenue engines across verticals from SaaS to manufacturing.
We are GROU, a B2B pipeline agency that runs lead generation, outbound, and LinkedIn content for clients across manufacturing, fintech, iGaming, software, and professional services. Benchmark ranges combine published 2026 conversion datasets with weighted medians from our client funnel deployments, anonymized to protect confidentiality.
Some links in this article are affiliate. We may earn a small commission at no extra cost to you. We only recommend tools we've deployed for clients.
The cross-industry MQL to SQL conversion rate sits around 13% in 2026, B2B SaaS averages 18-22%, and top-quartile teams convert 25-35%. The spread by channel is even wider: organic search MQLs convert at 45-51% while outbound-sourced MQLs land at 8-15%. If your rate looks bad, the first suspect is usually your MQL definition, not your sales team.
Here are the benchmarks by industry, channel, and deal size, plus the diagnostic we run before touching anything else in the funnel.
TL;DR
Benchmark yourself against segment, not the global average: 13% cross-industry, 18-22% for B2B SaaS, 25-35% for top-quartile SaaS teams, with MarTech (20-28%) and vertical SaaS (22-30%) running hottest. Channel decides more than industry: organic search (45-51%), referral (40-50%), and email nurture (40-46%) MQLs convert at 3-5x the rate of paid social (10-18%) and outbound-sourced (8-15%) MQLs. Deal size pulls the number down as ACV climbs, from 25-35% under $5K to 8-15% at enterprise. A healthy B2B funnel converts MQL to SQL above 15% within 30 days of the MQL trigger; below 10%, fix the definition and routing before blaming sales.
Related benchmarks: B2B SaaS pipeline benchmarks and CAC payback benchmarks.
The 2026 benchmarks by segment
Averages hide more than they show here, because "MQL" means different things in different motions. Anchor on your segment and quartile, and treat the global 13% as the floor for a functioning funnel, not the target.
Cross-industry average: ~13%. The number most published datasets converge on. Below 10%, the funnel is leaking at definition or routing.
B2B SaaS average: 18-22%. Product-led and mid-market SaaS motions qualify harder at the MQL stage, which lifts the conversion.
Top quartile B2B SaaS: 25-35%. These teams share two habits: scoring thresholds tied to buying signals, not content downloads, and same-day routing.
By vertical: vertical SaaS (22-30%) and MarTech (20-28%) convert best because buyers self-select tightly; FinTech (12-18%) and HR tech (15-20%) sit lower under committee-heavy buying. Forrester's buying research puts the average B2B buying committee at 13 stakeholders, and every added stakeholder taxes this stage.
Conversion by channel: the real driver
Channel source predicts MQL quality better than any scoring model we have deployed. The gap between the best and worst channel is roughly 5x, which is why blended averages mislead.
Organic search: 45-51%. The buyer arrived with the problem already named. Highest-intent MQL source in every dataset we have seen, which is half the argument for the content flywheel in our B2B content marketing strategy.
Referral and partner: 40-50%. Borrowed trust converts almost as well as organic intent.
Email nurture: 40-46%. Slow, cheap, compounding. The nurture-to-MQL bar is naturally high because the lead has survived a sequence.
LinkedIn Ads: 18-28% and paid search: 15-26%. Solid mid-tier when targeting is tight; collapses when lead-gen forms harvest low-commitment downloads.
Meta Ads: 10-18% and outbound SDR-sourced: 8-15%. Not failure, physics: these channels interrupt rather than capture demand. Their MQLs need different nurture and different SLAs, and per Gartner's B2B buying research, buyers spend only about 5% of the journey with any sales rep, so interrupted buyers take longer to ripen.
Deal size gravity, and how to diagnose your own rate
Bigger deals convert slower at every stage, and MQL to SQL is where it shows first. Benchmarks by ACV band: 25-35% under $5K, 18-25% at $5-25K, 12-20% at $25-100K, 8-15% at enterprise ACV.
The diagnostic, in order:
1. Definition audit. List the last 50 MQLs and mark which had a buying signal (pricing page, demo request, trial, competitor comparison) versus a content signal (ebook, webinar registration). If under half carry buying signals, the MQL bar is set at marketing's convenience, not sales reality. Our lead scoring template sets the thresholds.
2. Routing lag. Measure trigger-to-first-touch time. Conversion decays sharply after 24 hours; same-day touch is the single cheapest lift available.
3. Channel mix shift. Recompute the rate per channel before judging the blend. A "falling" conversion rate is often just paid volume growing faster than organic.
4. SLA check. If sales can demote MQLs without a reason code, the data is unusable. Add reason codes first, benchmark second.
The mistakes that flatter or sink the metric
Mistake 1: inflating MQL volume for the marketing report. Every low-intent MQL added to hit a volume target dilutes the conversion rate sales gets judged on. One number must own the handoff.
Mistake 2: benchmarking the blend against SaaS averages. A funnel that is 70% paid social should expect 12-16%, not 22%. Compare like channel mix to like.
Mistake 3: no time-boxing. An MQL that converts in month 6 is a different object from one converting in week 1. Report conversion inside 30, 60, and 90-day windows or trends are unreadable.
Mistake 4: fixing sales when the problem is scoring. If SQL-to-opportunity conversion is healthy but MQL-to-SQL is low, the leak is upstream in definition and routing, not in the SDR seat, as the stage-by-stage view in our sales pipeline stages guide shows.
FAQ
What is a good MQL to SQL conversion rate in 2026?
Above 13% is functional cross-industry, 18-22% is the B2B SaaS average, and 25%+ puts you in the top quartile. Judge the number against your channel mix and ACV band: 15% on an outbound-heavy funnel is strong, while 15% on an organic-heavy funnel is a definition problem.
Why is my MQL to SQL conversion rate so low?
Three causes in order of frequency: the MQL definition rewards content engagement instead of buying signals, routing takes longer than 24 hours, or the channel mix shifted toward paid and outbound sources without resetting expectations. Audit the last 50 MQLs before changing anything else.
What conversion rate should outbound-sourced MQLs hit?
8-15%. Outbound interrupts demand rather than capturing it, so its MQLs ripen slower. Give outbound-sourced leads their own nurture track and their own benchmark instead of blending them with inbound.
How fast should an MQL be routed to sales?
Same day, with the first touch inside 24 hours of the trigger. Conversion decays sharply with routing lag, and speed-to-lead is the cheapest lever on this list: no new budget, no new tooling, just an SLA.
What percentage of SQLs should become opportunities?
Healthy B2B funnels convert roughly 50-60% of SQLs to opportunities. If that stage is strong while MQL to SQL is weak, the leak is upstream in scoring and routing. If both are weak, revisit the ICP itself.
How do I measure MQL to SQL conversion correctly?
Time-box it: report the share of MQLs that reach SQL within 30, 60, and 90 days of the MQL trigger, split by source channel. Require a reason code on every rejected MQL. Blended, untimed, unattributed rates are the reason most teams cannot act on this metric.
Bottom line
The benchmark that matters is segment-, channel-, and ACV-adjusted: 13% cross-industry, 18-22% B2B SaaS, 45%+ from organic, 8-15% from outbound. Before spending a euro to move the number, run the four-step diagnostic: definition audit, routing lag, channel mix, SLA. In our deployment experience the definition audit alone explains most "conversion crises", and same-day routing is the fastest lift.
Want the scoring, routing, and reporting built properly? Book a call with GROU. We build lead qualification systems inside B2B revenue engines across verticals from SaaS to manufacturing.
We are GROU, a B2B pipeline agency that runs lead generation, outbound, and LinkedIn content for clients across manufacturing, fintech, iGaming, software, and professional services. Benchmark ranges combine published 2026 conversion datasets with weighted medians from our client funnel deployments, anonymized to protect confidentiality.
Some links in this article are affiliate. We may earn a small commission at no extra cost to you. We only recommend tools we've deployed for clients.

Pipeline OS Newsletter
Build qualified pipeline
Get weekly tactics to generate demand, improve lead quality, and book more meetings.





Trusted by industry leaders
Trusted by industry leaders
Trusted by industry leaders
Ready to build qualified pipeline?
Ready to build qualified pipeline?
Ready to build qualified pipeline?
Book a call to see if we're the right fit, or take the 2-minute quiz to get a clear starting point.
Book a call to see if we're the right fit, or take the 2-minute quiz to get a clear starting point.
Book a call to see if we're the right fit, or take the 2-minute quiz to get a clear starting point.
" height="30.21639343089746px" id="hfGbXmQR2" width="30.216393430897455px"/></svg>)
Copyright © 2026 – All Right Reserved
Copyright © 2026 – All Right Reserved
Copyright © 2026 – All Right Reserved