%22%3E%3C/path%3E%3Cpath d=%22M 63.072 7.554 C 62.258 8.022 61.577 8.689 61.092 9.493 L 61.092 7.076 L 57.158 7.076 L 57.158 22.64 L 61.089 22.64 L 61.089 14.888 C 61.089 13.446 61.403 12.434 62.03 11.853 C 62.818 11.218 63.818 10.907 64.826 10.982 L 65.868 10.982 L 65.868 6.851 C 64.891 6.834 63.926 7.076 63.073 7.554 Z%22 fill=%22rgb(17,17,17)%22%3E%3C/path%3E%3Cpath d=%22M 78.916 7.82 C 76.363 6.49 73.321 6.49 70.768 7.82 C 69.562 8.473 68.564 9.451 67.888 10.644 C 67.167 11.931 66.803 13.387 66.834 14.862 C 66.804 16.332 67.157 17.785 67.86 19.077 C 68.515 20.267 69.494 21.246 70.684 21.901 C 71.924 22.576 73.318 22.92 74.73 22.898 C 76.164 22.918 77.58 22.575 78.846 21.901 C 80.062 21.247 81.073 20.27 81.768 19.077 C 82.506 17.797 82.88 16.339 82.85 14.862 C 82.88 13.389 82.517 11.934 81.797 10.647 C 81.12 9.455 80.122 8.477 78.917 7.824 M 78.803 14.862 C 78.829 15.739 78.636 16.608 78.241 17.391 C 77.903 18.046 77.38 18.588 76.738 18.95 C 76.124 19.293 75.432 19.472 74.729 19.47 C 73.668 19.497 72.648 19.061 71.934 18.276 C 71.139 17.323 70.741 16.1 70.823 14.862 C 70.741 13.62 71.149 12.395 71.959 11.45 C 72.687 10.667 73.715 10.233 74.783 10.256 C 75.859 10.236 76.894 10.67 77.635 11.45 C 78.464 12.387 78.884 13.616 78.801 14.864%22 fill=%22rgb(17,17,17)%22%3E%3C/path%3E%3Cpath d=%22M 95.906 7.076 L 95.906 15.646 C 95.975 16.68 95.643 17.701 94.979 18.498 C 94.311 19.184 93.379 19.547 92.422 19.495 C 91.475 19.544 90.553 19.18 89.894 18.498 C 89.23 17.701 88.898 16.68 88.967 15.646 L 88.967 7.076 L 85.033 7.076 L 85.033 16.207 C 85 17.449 85.275 18.68 85.834 19.79 C 86.327 20.75 87.095 21.542 88.039 22.065 C 89.033 22.594 90.145 22.861 91.271 22.838 C 92.188 22.847 93.095 22.65 93.926 22.263 C 94.708 21.905 95.388 21.36 95.906 20.675 L 95.906 22.645 L 99.865 22.645 L 99.865 7.076 Z%22 fill=%22rgb(17,17,17)%22%3E%3C/path%3E%3Cpath d=%22M 4.513 15.626 C 4.511 10.815 7.606 6.549 12.181 5.059 C 16.756 3.57 21.77 5.195 24.601 9.086 L 27.816 5.87 C 24.074 1.186 17.981 -0.943 12.137 0.393 C 6.292 1.728 1.728 6.292 0.393 12.137 C -0.943 17.981 1.186 24.074 5.87 27.816 L 9.085 24.601 C 6.214 22.512 4.515 19.177 4.513 15.626%22 fill=%22rgb(32,62,235)%22%3E%3C/path%3E%3Cpath d=%22M 17.114 14.343 L 13.354 18.01 L 13.354 18.026 L 21.071 18.026 L 11.412 27.609 L 17.389 27.609 L 23.999 21.081 L 23.999 28.316 L 24.005 28.316 L 27.967 24.393 L 27.967 14.343 Z%22 fill=%22rgb(32,62,235)%22%3E%3C/path%3E%3C/g%3E%3C/svg%3E) ×
× ××
××›
›
›
›
SaaS customer acquisition cost: calculate and reduce CAC 2026
SaaS customer acquisition cost: calculate and reduce CAC 2026
SaaS customer acquisition cost: calculate and reduce CAC 2026
SaaS customer acquisition cost: calculate and reduce CAC 2026
SaaS customer acquisition cost: calculate and reduce CAC 2026
SaaS customer acquisition cost: calculate and reduce CAC 2026

Author
Aljaz Peklaj

You already have a CAC number in your dashboard. The problem is you probably can't trust it. If your team is dividing ad spend by closed customers, or even sales and marketing spend without loaded labor and overhead, you're making allocation decisions on a partial cost model while trying to scale in a market where acquisition has gotten more expensive.
Full-cost CAC is the only version worth using for planning headcount, channel mix, and runway.
Benchmarks only help after you calculate CAC the same way every month or quarter.
A real campaign can look healthy or broken depending on whether you include labor, tools, and overhead.
Personnel cost usually drives CAC hardest, so fixing productivity matters more than shaving a tool bill.
Signal-triggered intake is the structural move that cuts waste before reps burn hours on bad pipeline.
Table of Contents
The full-cost formula for CAC and why most are wrong
Many organizations understate SaaS customer acquisition cost because they exclude the expensive parts that sit outside media spend. That's convenient for reporting. It's terrible for decision-making.
The formula we actually use
The version worth tracking is simple:
CAC = total sales and marketing spend in a period / new customers acquired in the same period
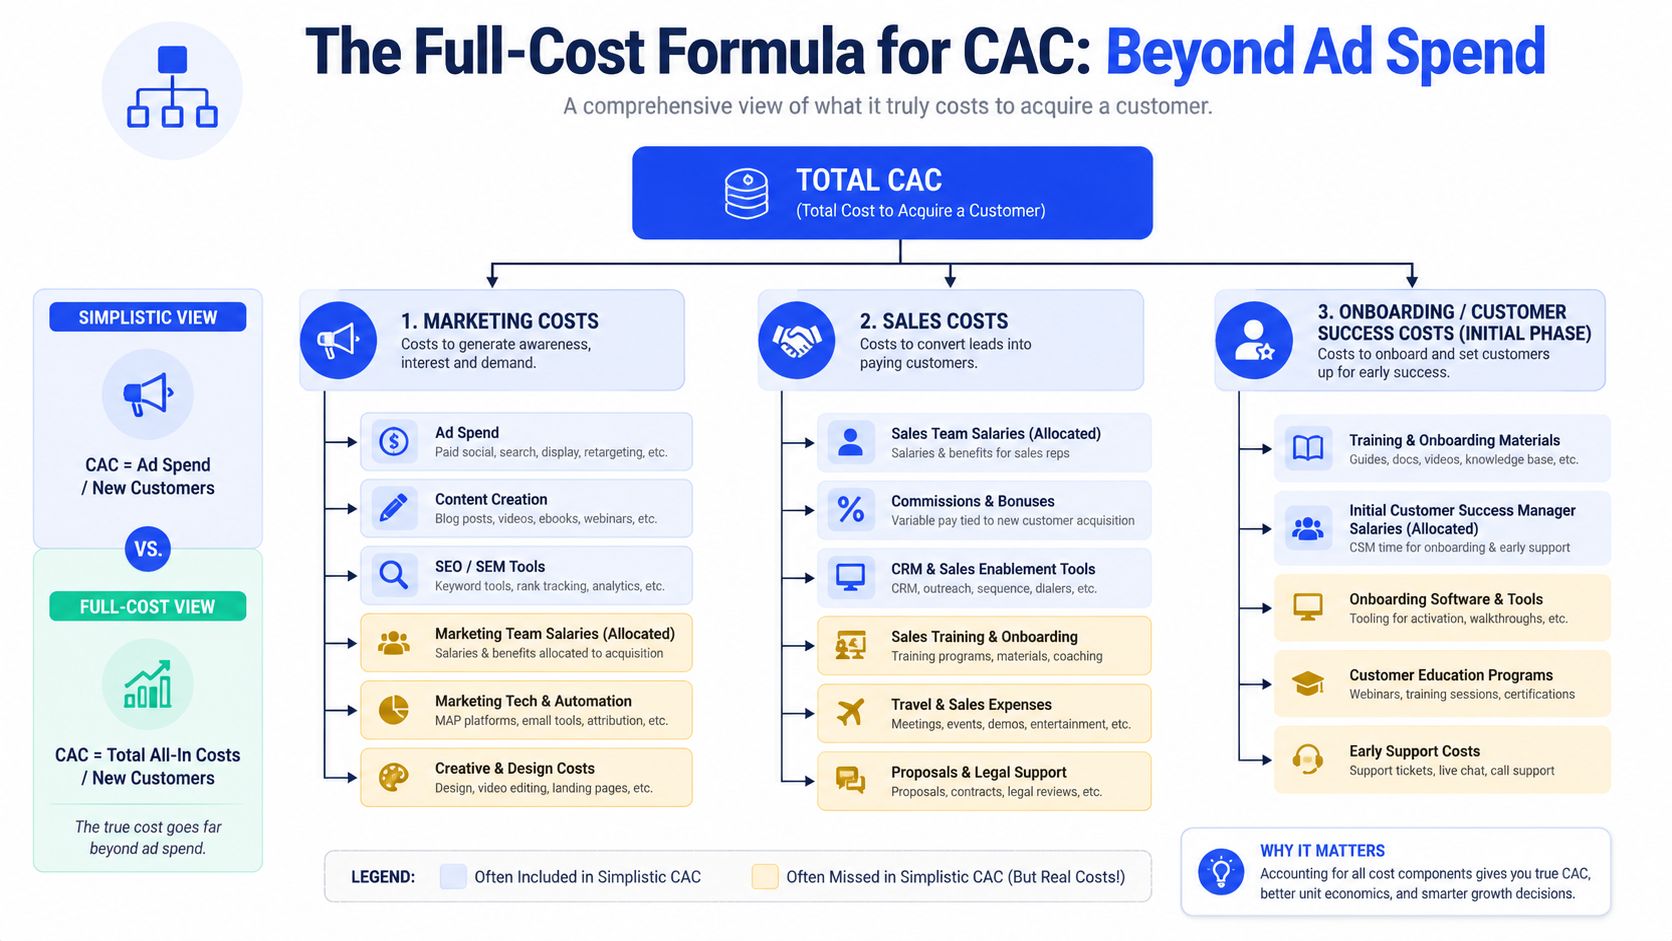
The important part is what goes into "total sales and marketing spend." For an honest number, include:
Direct acquisition spend → paid media, acquisition content, events, conference travel, agency fees
Tooling → HubSpot, Apollo, Clay, Sales Navigator, Lemlist, Instantly, Smartlead, HeyReach, enrichment and verification
Loaded personnel → AEs, SDRs, marketing, sales ops, marketing ops, enablement, and the share of CRO, CMO, or CEO time spent on acquisition
Allocated overhead → office cost for revenue teams, shared software, recruiting for sales and marketing hires, contract-related legal cost
What stays out matters too. Customer success belongs in retention math. Product development isn't acquisition. Brand work with no direct acquisition intent should sit in a separate bucket.
Why narrow CAC creates bad decisions
The usual shortcut is paid media divided by customers. The slightly better shortcut is ad spend plus software. Both miss the largest operating reality in B2B revenue teams, people cost.
That blind spot gets worse when pipeline quality is weak. Data cited in this analysis of unqualified pipeline distorting CAC shows 60–70% of B2B SaaS leads from outbound or paid channels are disqualified before sales engagement, which means reported CAC can be 2–3x lower than the true cost of acquiring a viable prospect.
Practical rule: If your CAC excludes the cost of the people who generated, qualified, chased, and closed the customer, it isn't a business metric. It's a media metric.
This is also why attribution discipline matters. Blended CAC should be the primary number, then channel views can sit underneath it with first-touch, last-touch, or multi-touch context. If your attribution is messy, start by cleaning the reporting line before you start defending channel budgets. This guide on multi-touch attribution for B2B teams is useful if your CRM still credits the final touch with all the work.
For teams trying to reduce wasted spend before they rebuild reporting, this resource on Lowering acquisition spend for marketers is worth scanning because it pushes you toward channel discipline rather than vanity efficiency.
SaaS CAC benchmarks for 2026
Here's the verdict up front. Don't benchmark your number against a generic SaaS average and call it done. Compare it against your sales model, your ACV range, your payback profile, and your LTV:CAC ratio. Otherwise you'll either panic too early or miss a serious problem.
What the market is telling you
Projected 2026 benchmark data shows the median B2B SaaS CAC has a 16x divergence by sales model, $702 for self-serve versus $11,400 for sales-led acquisition, with SMB-focused SaaS usually landing around $500–$750 and enterprise motions at $6,000–$15,000+ according to Digital Applied's benchmark review. That's the cleanest proof that one headline average is almost useless.
The same issue shows up at industry level. The average B2B SaaS CAC is described as roughly $1,200 per customer in 2025, with a jump of 40–60% between 2023 and 2025, and enterprise acquisitions ranging from $6,000 to over $15,000 in the GTM8020 benchmark roundup. If you're selling into legal tech, pharma, manufacturing, or a mid-market SaaS buyer with committee review, you shouldn't compare yourself to a self-serve product-led motion.
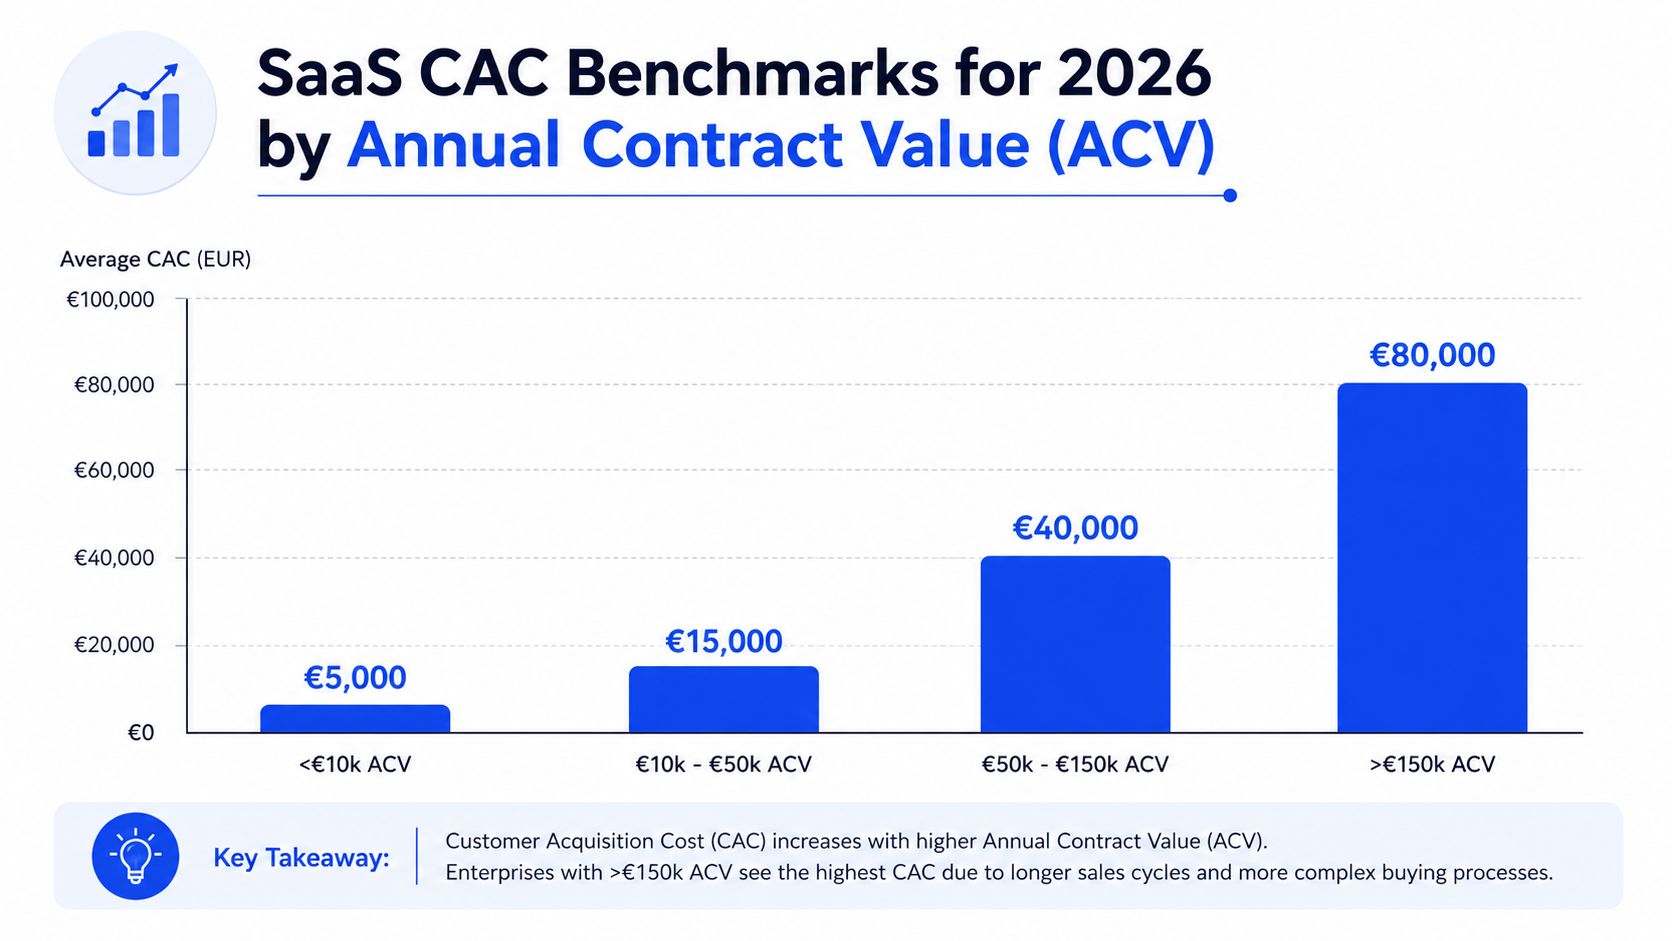
A second market signal matters even more for finance planning. The median SaaS company is projected to spend $2.00 to acquire every $1.00 of new ARR in 2026, up from $1.83 in 2023, while the top quartile spends $1.00 and the bottom quartile spends $2.82 for the same dollar of ARR in the Amra and Elma SaaS acquisition report.
The ratios that matter more than the headline CAC
A standalone CAC figure is blunt. The ratio set tells you whether the machine works.
Metric | Healthy read | Why it matters |
|---|---|---|
LTV:CAC | At least 3:1 | Below that, the business is paying too much for what the customer returns |
CAC payback | Under 12 months is healthy for B2B SaaS | It tells you how long cash stays tied up before a customer becomes profitable |
Spend per new ARR | Lower is better, with large spread across quartiles | It reveals whether growth is efficient or funded by burn |
Usermaven's benchmark on healthy CLV to CAC economics is blunt on this point. A healthy SaaS business should target at least a 3:1 CLV:CAC ratio.
For payback, the projected benchmark from B2B SaaS CAC payback data puts the median B2B SaaS recovery period at 8.6 months, and anything under 12 months is considered healthy. If you need another reference point for that metric, this breakdown of CAC payback period benchmarks is a practical companion when you're modeling runway.
If you're a founder, don't ask whether CAC is "good." Ask whether cash comes back fast enough, and whether the customer returns enough gross profit to justify the sales motion.
A real-world CAC breakdown from a €180k campaign
A fully-loaded model only matters if it changes what you see. Here's a campaign where it did.
What went into the spend
This was a six-month B2B SaaS engagement in the revenue operations category, aimed at heads of RevOps at companies with 100 to 500 employees. The average ACV was €42k.
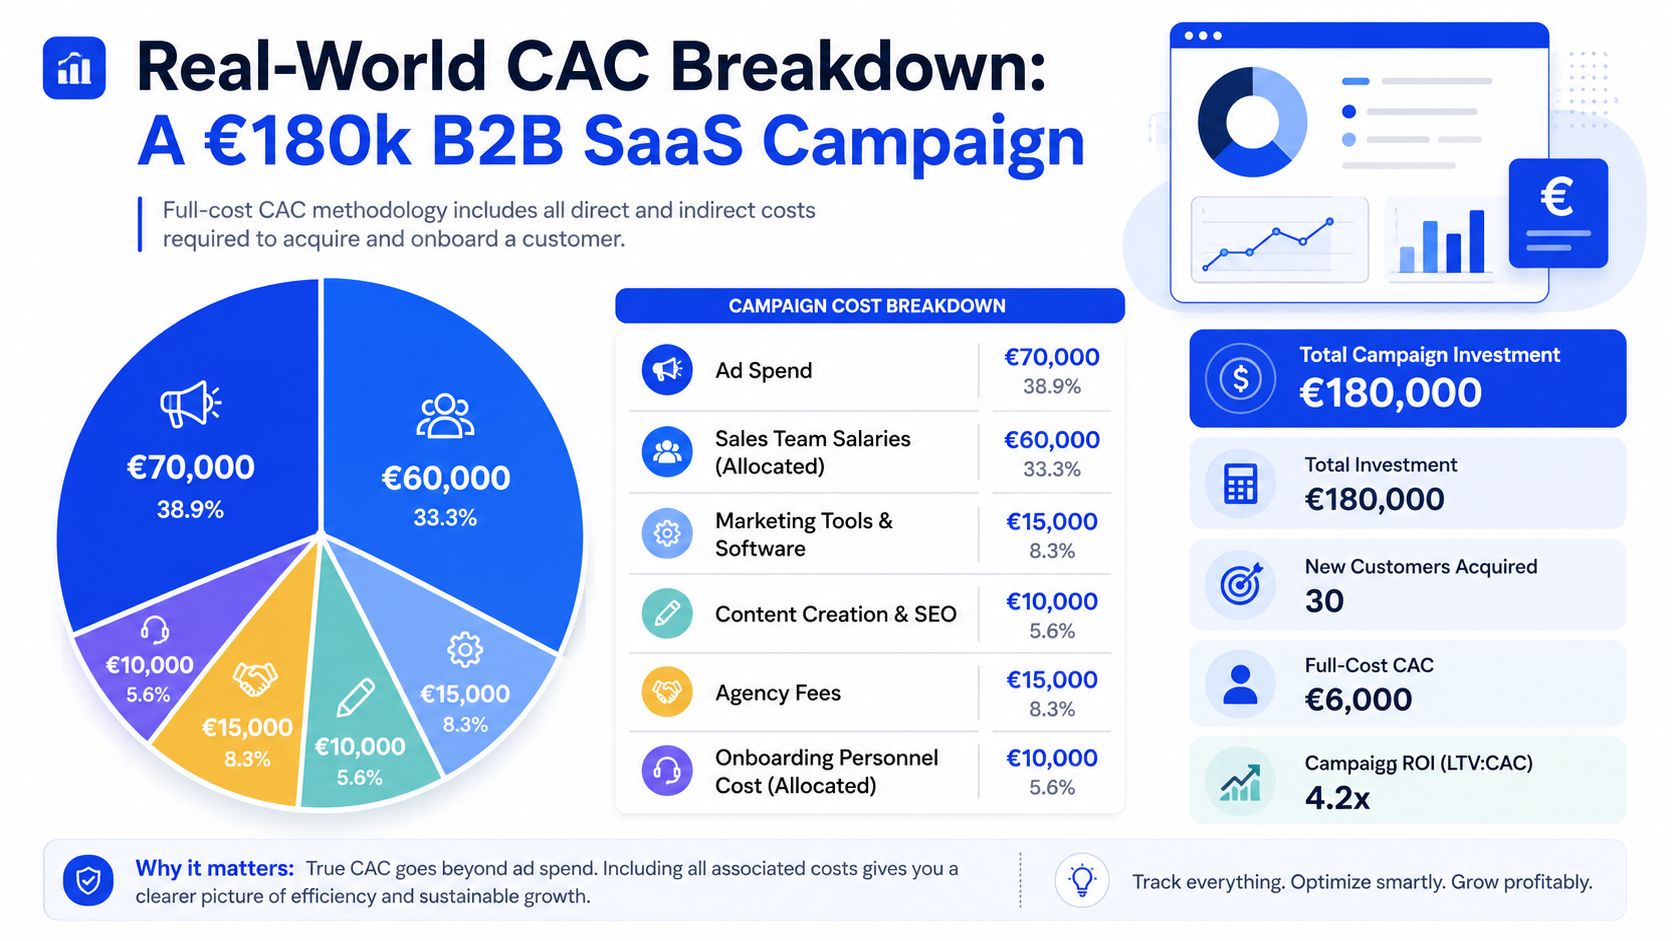
The total acquisition investment was €180,050. It broke down like this:
Agency spend → €45,000
Allocated tool cost → roughly €38,000 across Clay, Apollo, Sales Navigator, Lemlist, HeyReach, HubSpot, verification, and Loom
Allocated personnel cost → roughly €54,850 across one AE, one SDR, CEO time, and a marketing coordinator
Paid media → €34,000 across LinkedIn Ads, Google Ads, and Meta retargeting
Overhead → roughly €8,200
The campaign produced 78 qualified meetings, 47 qualified opportunities, and 7 closed-won deals during the engagement, plus 3 additional closed-won deals in the following 90 days from pipeline created during the period. Total attributable outcome was 10 customers and roughly €420k ARR.
What the math looks like depending on honesty level
Using full-cost CAC:
Calculation view | Math | Result |
|---|---|---|
Fully-loaded blended CAC | €180,050 / 10 | €18,005 |
Direct-spend-only CAC | €117,000 / 10 | €11,700 |
Paid-media-only CAC | €34,000 / 10 | €3,400 |
This is the whole argument in one table. Same campaign. Same customers. Three different stories.
The €18,005 number is the one you can use for planning because it reflects what the company spent to create those customers. The €11,700 number is incomplete. The €3,400 number is almost decorative.
There was another reason this campaign held up under scrutiny. The economics behind the CAC were strong enough to justify the motion:
CAC to ACV ratio → 43% of first-year ACV
CAC payback → 6.9 months, based on roughly €31,500 annual gross profit per customer and roughly €2,625 monthly gross profit
LTV to CAC ratio → 6.1x, based on roughly €110,250 lifetime gross profit per customer
"Paid-media CAC can help you compare channels. It can't tell you whether the business is buying growth profitably."
A few execution choices helped. Signal-triggered intake improved prospect quality. The mix of LinkedIn, email, founder content, and selective paid media worked as one system instead of four separate campaigns. Personalized Loom at proposal stage helped compress cycle time. Fast reply routing made it easier to capture interest while it was still warm.
If you want to compare that kind of full-funnel thinking against another structured B2B motion, this market entry and lead generation case study for an automotive retail SaaS platform is a useful reference.
The primary drivers of high CAC
High CAC usually gets blamed on LinkedIn CPCs, bad ad creative, or expensive tools. That's not where I start. In most B2B SaaS environments, the bigger issue is how many human hours the company burns to produce one customer.
Why labor dominates the number
Across full-cost CAC models, personnel costs typically represent 50 to 70% of total CAC. That includes AE time, SDR work, marketing execution, RevOps support, enablement, and executive involvement in pipeline creation and deal progression.
Once you accept that, the operating question changes. You stop asking, "Can we cut software spend?" and start asking, "Why does it take this many AE hours to close a deal?"
That matters more in categories like SaaS, manufacturing, legal tech, pharma, and iGaming B2B partnerships where sales cycles involve more stakeholders, more validation, and more custom follow-up.
What usually makes CAC spike
A few patterns show up again and again:
Weak meeting quality means AEs spend time on calls that should never have been booked.
Slow follow-up lets interested buyers cool off before the account team gets involved.
Static list-building floods the top of funnel with accounts that fit the ICP on paper but show no buying motion.
Overuse of paid social pushes spend up before messaging and qualification are tight. For context, channel CAC benchmarks cite $150 per customer for referrals, $480 for content/SEO, and more than $2,000 for LinkedIn ads.
If your LTV:CAC ratio is under the 3:1 threshold covered in the earlier benchmark section, that's a red flag, not a timing issue. This review of LinkedIn ad costs in B2B demand generation is useful when the paid side is soaking up budget but sales productivity still isn't where it needs to be.
The practical point is simple. CAC doesn't stay high because software is expensive. It stays high because teams allow low-intent pipeline to consume expensive labor.
How to cut your SaaS CAC by 30-50 percent
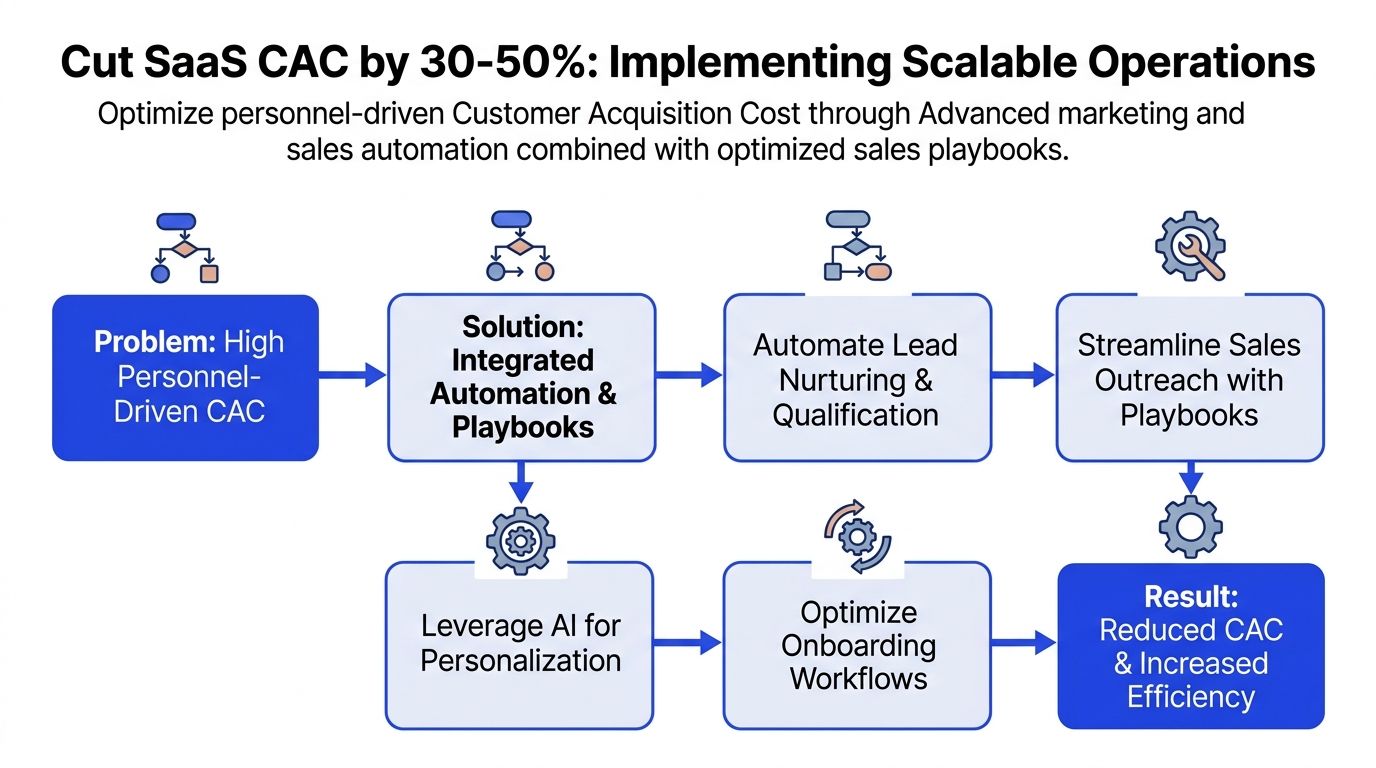
The move I recommend first is clear. Replace static list-building with signal-triggered intake. For most outbound-heavy SaaS teams, that's the fastest structural fix because it improves timing before reps waste hours on poor-fit accounts.
Replace static lists with signal-triggered intake
In practice, this means your outbound queue isn't just "accounts that match the ICP." It's accounts that match the ICP and show a live reason to buy.
The signals worth monitoring depend on category, but common ones include:
Job changes → new VP Sales, new Head of RevOps, new demand gen lead
Funding or expansion events → budget changes often precede system changes
Hiring patterns → active hiring for BDRs, RevOps, QA, regulatory, or compliance roles
Tool-stack changes → a fresh install or replacement signal often opens a wedge
Public pain statements → LinkedIn posts, webinars, event panels, and comment threads
A Clay-led setup usually does the monitoring and enrichment. Apollo can support contact and account data. Sales Navigator helps validate account movement. Lemlist, Instantly, Smartlead, or HeyReach can handle execution depending on your sequencing model. HubSpot should remain the source of truth.
Build the system in the tools your team already uses
The operating sequence is straightforward:
Map closed-won patterns
Pull recent wins from HubSpot. Look for repeated buying triggers, not just firmographic fit.Create signal fields at account and contact level
Add columns for signal type, signal date, source, owner, and message angle.Set routing rules
High-intent signals should route fast. Low-confidence signals can enter a slower sequence or stay in monitoring.Write trigger-based messaging
Outreach should reference the signal naturally. If the reason for contact isn't obvious in the first lines, the signal wasn't useful enough.Review held-meeting quality weekly
Don't judge the system on reply rate alone. Watch held rate, opportunity creation, and sales acceptance.
The reason this works is timing. Better timing raises conversion and reduces wasted labor. The verified data point worth paying attention to here is from Ratiotech's write-up on AI and CAC trade-offs. It notes that AI-personalized outbound can raise CAC by 15–25% early on because tooling and data costs go up, yet it can improve lead-to-meeting conversion by 40%, with lifetime CAC getting more efficient only after 6+ months.
That trade-off matters. Teams often add AI tooling and expect instant CAC relief. Early on, cost can rise. The payoff comes when better prospect selection and better messaging reduce labor waste across the funnel.
For proposal-stage acceleration, product walkthroughs help too. If your AEs still explain the product from scratch in every late-stage call, this effective product demo video guide is a practical companion.
A short walkthrough helps frame the mechanics in context:
If you need the KPI layer around this system, this lead generation KPI framework is the place to tighten measurement. Watch response speed, held rate, opportunity rate, and close rate by signal class. That's where the cost story becomes visible.
Your next steps to control CAC
A founder reviews CAC in the board pack, sees a number that looks manageable, and pushes for more spend. Two weeks later, pipeline is up, cash burn is up, and nothing about payback feels better. That usually happens because the company is still managing a partial CAC number instead of the fully loaded one.
Start in the CRM and in the general ledger. Reconcile one closed-won cohort and one lost cohort from the last 30 to 60 days. If marketing spend says €40,000 but the motion also consumed SDR time, AE time, sales tools, enrichment credits, contractor support, and management overhead, the reported CAC is not wrong by a little. It is directionally wrong.
Do these three operational checks this week
Rebuild CAC with full cost allocation
Pull paid media, software, agencies, SDR salaries, AE salaries tied to new business, sales management allocation, data vendors, and a fair share of overhead into one model. If finance and RevOps cannot trace the inputs, treat the CAC number as incomplete.Add a "signal source" field in HubSpot by Monday
Every outbound opportunity should show what triggered outreach: hiring event, funding round, product usage signal, inbound revisit, partner referral, or list-based prospecting. If the source is blank, the team cannot tell whether conversion came from targeting quality or rep effort.Audit held-meeting rate by source, not just booked meetings
Booked meetings make weak channels look healthy. Held rate shows whether the account was qualified enough to deserve calendar time from an SDR or AE.
One more check separates disciplined teams from noisy ones. Compare CAC by source at the sales-accepted pipeline level, not at lead or meeting level. A channel that creates cheap meetings can still produce expensive revenue if opportunities stall, require extra calls, or need heavy AE rescue.
Tighten execution where CAC usually leaks
Three changes tend to cut waste fast:
Speed up reply handling
Route replies from Apollo, Lemlist, Smartlead, or Instantly into Slack and CRM ownership rules so an AE can respond while intent is still live. Slow handoff creates preventable no-shows and lower conversion on opportunities you already paid to generate.Use short personalized video late in the cycle
A focused Loom for the buying committee can reduce repeat explanation work from AEs. Keep it tied to the prospect's workflow, rollout risk, and expected outcome, not a generic product tour.Measure social with pipeline rules, not engagement screenshots
If social sits anywhere in your acquisition mix, use these social media return on investment methods to connect activity to sourced pipeline, influenced pipeline, and closed-won revenue.
The next useful CAC conversation is not "how do we get the number down?" It is "which stage is making expensive people spend time on work that should have been filtered out earlier?"
Run the held-rate audit this Friday. Add the signal-source field by Monday. Then review one month of opportunities and cut the sources that create motion without creating sales-accepted pipeline.
Grou helps B2B teams build pipeline systems that turn attention into qualified conversations across SaaS, iGaming, manufacturing, legal tech, and pharma. The work runs through one reporting line, shared execution sprints, and a single revenue engine built around list quality, message fit, fast routing, and clean attribution, see Grou.
You already have a CAC number in your dashboard. The problem is you probably can't trust it. If your team is dividing ad spend by closed customers, or even sales and marketing spend without loaded labor and overhead, you're making allocation decisions on a partial cost model while trying to scale in a market where acquisition has gotten more expensive.
Full-cost CAC is the only version worth using for planning headcount, channel mix, and runway.
Benchmarks only help after you calculate CAC the same way every month or quarter.
A real campaign can look healthy or broken depending on whether you include labor, tools, and overhead.
Personnel cost usually drives CAC hardest, so fixing productivity matters more than shaving a tool bill.
Signal-triggered intake is the structural move that cuts waste before reps burn hours on bad pipeline.
Table of Contents
The full-cost formula for CAC and why most are wrong
Many organizations understate SaaS customer acquisition cost because they exclude the expensive parts that sit outside media spend. That's convenient for reporting. It's terrible for decision-making.
The formula we actually use
The version worth tracking is simple:
CAC = total sales and marketing spend in a period / new customers acquired in the same period
The important part is what goes into "total sales and marketing spend." For an honest number, include:
Direct acquisition spend → paid media, acquisition content, events, conference travel, agency fees
Tooling → HubSpot, Apollo, Clay, Sales Navigator, Lemlist, Instantly, Smartlead, HeyReach, enrichment and verification
Loaded personnel → AEs, SDRs, marketing, sales ops, marketing ops, enablement, and the share of CRO, CMO, or CEO time spent on acquisition
Allocated overhead → office cost for revenue teams, shared software, recruiting for sales and marketing hires, contract-related legal cost
What stays out matters too. Customer success belongs in retention math. Product development isn't acquisition. Brand work with no direct acquisition intent should sit in a separate bucket.
Why narrow CAC creates bad decisions
The usual shortcut is paid media divided by customers. The slightly better shortcut is ad spend plus software. Both miss the largest operating reality in B2B revenue teams, people cost.
That blind spot gets worse when pipeline quality is weak. Data cited in this analysis of unqualified pipeline distorting CAC shows 60–70% of B2B SaaS leads from outbound or paid channels are disqualified before sales engagement, which means reported CAC can be 2–3x lower than the true cost of acquiring a viable prospect.
Practical rule: If your CAC excludes the cost of the people who generated, qualified, chased, and closed the customer, it isn't a business metric. It's a media metric.
This is also why attribution discipline matters. Blended CAC should be the primary number, then channel views can sit underneath it with first-touch, last-touch, or multi-touch context. If your attribution is messy, start by cleaning the reporting line before you start defending channel budgets. This guide on multi-touch attribution for B2B teams is useful if your CRM still credits the final touch with all the work.
For teams trying to reduce wasted spend before they rebuild reporting, this resource on Lowering acquisition spend for marketers is worth scanning because it pushes you toward channel discipline rather than vanity efficiency.
SaaS CAC benchmarks for 2026
Here's the verdict up front. Don't benchmark your number against a generic SaaS average and call it done. Compare it against your sales model, your ACV range, your payback profile, and your LTV:CAC ratio. Otherwise you'll either panic too early or miss a serious problem.
What the market is telling you
Projected 2026 benchmark data shows the median B2B SaaS CAC has a 16x divergence by sales model, $702 for self-serve versus $11,400 for sales-led acquisition, with SMB-focused SaaS usually landing around $500–$750 and enterprise motions at $6,000–$15,000+ according to Digital Applied's benchmark review. That's the cleanest proof that one headline average is almost useless.
The same issue shows up at industry level. The average B2B SaaS CAC is described as roughly $1,200 per customer in 2025, with a jump of 40–60% between 2023 and 2025, and enterprise acquisitions ranging from $6,000 to over $15,000 in the GTM8020 benchmark roundup. If you're selling into legal tech, pharma, manufacturing, or a mid-market SaaS buyer with committee review, you shouldn't compare yourself to a self-serve product-led motion.
A second market signal matters even more for finance planning. The median SaaS company is projected to spend $2.00 to acquire every $1.00 of new ARR in 2026, up from $1.83 in 2023, while the top quartile spends $1.00 and the bottom quartile spends $2.82 for the same dollar of ARR in the Amra and Elma SaaS acquisition report.
The ratios that matter more than the headline CAC
A standalone CAC figure is blunt. The ratio set tells you whether the machine works.
Metric | Healthy read | Why it matters |
|---|---|---|
LTV:CAC | At least 3:1 | Below that, the business is paying too much for what the customer returns |
CAC payback | Under 12 months is healthy for B2B SaaS | It tells you how long cash stays tied up before a customer becomes profitable |
Spend per new ARR | Lower is better, with large spread across quartiles | It reveals whether growth is efficient or funded by burn |
Usermaven's benchmark on healthy CLV to CAC economics is blunt on this point. A healthy SaaS business should target at least a 3:1 CLV:CAC ratio.
For payback, the projected benchmark from B2B SaaS CAC payback data puts the median B2B SaaS recovery period at 8.6 months, and anything under 12 months is considered healthy. If you need another reference point for that metric, this breakdown of CAC payback period benchmarks is a practical companion when you're modeling runway.
If you're a founder, don't ask whether CAC is "good." Ask whether cash comes back fast enough, and whether the customer returns enough gross profit to justify the sales motion.
A real-world CAC breakdown from a €180k campaign
A fully-loaded model only matters if it changes what you see. Here's a campaign where it did.
What went into the spend
This was a six-month B2B SaaS engagement in the revenue operations category, aimed at heads of RevOps at companies with 100 to 500 employees. The average ACV was €42k.
The total acquisition investment was €180,050. It broke down like this:
Agency spend → €45,000
Allocated tool cost → roughly €38,000 across Clay, Apollo, Sales Navigator, Lemlist, HeyReach, HubSpot, verification, and Loom
Allocated personnel cost → roughly €54,850 across one AE, one SDR, CEO time, and a marketing coordinator
Paid media → €34,000 across LinkedIn Ads, Google Ads, and Meta retargeting
Overhead → roughly €8,200
The campaign produced 78 qualified meetings, 47 qualified opportunities, and 7 closed-won deals during the engagement, plus 3 additional closed-won deals in the following 90 days from pipeline created during the period. Total attributable outcome was 10 customers and roughly €420k ARR.
What the math looks like depending on honesty level
Using full-cost CAC:
Calculation view | Math | Result |
|---|---|---|
Fully-loaded blended CAC | €180,050 / 10 | €18,005 |
Direct-spend-only CAC | €117,000 / 10 | €11,700 |
Paid-media-only CAC | €34,000 / 10 | €3,400 |
This is the whole argument in one table. Same campaign. Same customers. Three different stories.
The €18,005 number is the one you can use for planning because it reflects what the company spent to create those customers. The €11,700 number is incomplete. The €3,400 number is almost decorative.
There was another reason this campaign held up under scrutiny. The economics behind the CAC were strong enough to justify the motion:
CAC to ACV ratio → 43% of first-year ACV
CAC payback → 6.9 months, based on roughly €31,500 annual gross profit per customer and roughly €2,625 monthly gross profit
LTV to CAC ratio → 6.1x, based on roughly €110,250 lifetime gross profit per customer
"Paid-media CAC can help you compare channels. It can't tell you whether the business is buying growth profitably."
A few execution choices helped. Signal-triggered intake improved prospect quality. The mix of LinkedIn, email, founder content, and selective paid media worked as one system instead of four separate campaigns. Personalized Loom at proposal stage helped compress cycle time. Fast reply routing made it easier to capture interest while it was still warm.
If you want to compare that kind of full-funnel thinking against another structured B2B motion, this market entry and lead generation case study for an automotive retail SaaS platform is a useful reference.
The primary drivers of high CAC
High CAC usually gets blamed on LinkedIn CPCs, bad ad creative, or expensive tools. That's not where I start. In most B2B SaaS environments, the bigger issue is how many human hours the company burns to produce one customer.
Why labor dominates the number
Across full-cost CAC models, personnel costs typically represent 50 to 70% of total CAC. That includes AE time, SDR work, marketing execution, RevOps support, enablement, and executive involvement in pipeline creation and deal progression.
Once you accept that, the operating question changes. You stop asking, "Can we cut software spend?" and start asking, "Why does it take this many AE hours to close a deal?"
That matters more in categories like SaaS, manufacturing, legal tech, pharma, and iGaming B2B partnerships where sales cycles involve more stakeholders, more validation, and more custom follow-up.
What usually makes CAC spike
A few patterns show up again and again:
Weak meeting quality means AEs spend time on calls that should never have been booked.
Slow follow-up lets interested buyers cool off before the account team gets involved.
Static list-building floods the top of funnel with accounts that fit the ICP on paper but show no buying motion.
Overuse of paid social pushes spend up before messaging and qualification are tight. For context, channel CAC benchmarks cite $150 per customer for referrals, $480 for content/SEO, and more than $2,000 for LinkedIn ads.
If your LTV:CAC ratio is under the 3:1 threshold covered in the earlier benchmark section, that's a red flag, not a timing issue. This review of LinkedIn ad costs in B2B demand generation is useful when the paid side is soaking up budget but sales productivity still isn't where it needs to be.
The practical point is simple. CAC doesn't stay high because software is expensive. It stays high because teams allow low-intent pipeline to consume expensive labor.
How to cut your SaaS CAC by 30-50 percent
The move I recommend first is clear. Replace static list-building with signal-triggered intake. For most outbound-heavy SaaS teams, that's the fastest structural fix because it improves timing before reps waste hours on poor-fit accounts.
Replace static lists with signal-triggered intake
In practice, this means your outbound queue isn't just "accounts that match the ICP." It's accounts that match the ICP and show a live reason to buy.
The signals worth monitoring depend on category, but common ones include:
Job changes → new VP Sales, new Head of RevOps, new demand gen lead
Funding or expansion events → budget changes often precede system changes
Hiring patterns → active hiring for BDRs, RevOps, QA, regulatory, or compliance roles
Tool-stack changes → a fresh install or replacement signal often opens a wedge
Public pain statements → LinkedIn posts, webinars, event panels, and comment threads
A Clay-led setup usually does the monitoring and enrichment. Apollo can support contact and account data. Sales Navigator helps validate account movement. Lemlist, Instantly, Smartlead, or HeyReach can handle execution depending on your sequencing model. HubSpot should remain the source of truth.
Build the system in the tools your team already uses
The operating sequence is straightforward:
Map closed-won patterns
Pull recent wins from HubSpot. Look for repeated buying triggers, not just firmographic fit.Create signal fields at account and contact level
Add columns for signal type, signal date, source, owner, and message angle.Set routing rules
High-intent signals should route fast. Low-confidence signals can enter a slower sequence or stay in monitoring.Write trigger-based messaging
Outreach should reference the signal naturally. If the reason for contact isn't obvious in the first lines, the signal wasn't useful enough.Review held-meeting quality weekly
Don't judge the system on reply rate alone. Watch held rate, opportunity creation, and sales acceptance.
The reason this works is timing. Better timing raises conversion and reduces wasted labor. The verified data point worth paying attention to here is from Ratiotech's write-up on AI and CAC trade-offs. It notes that AI-personalized outbound can raise CAC by 15–25% early on because tooling and data costs go up, yet it can improve lead-to-meeting conversion by 40%, with lifetime CAC getting more efficient only after 6+ months.
That trade-off matters. Teams often add AI tooling and expect instant CAC relief. Early on, cost can rise. The payoff comes when better prospect selection and better messaging reduce labor waste across the funnel.
For proposal-stage acceleration, product walkthroughs help too. If your AEs still explain the product from scratch in every late-stage call, this effective product demo video guide is a practical companion.
A short walkthrough helps frame the mechanics in context:
If you need the KPI layer around this system, this lead generation KPI framework is the place to tighten measurement. Watch response speed, held rate, opportunity rate, and close rate by signal class. That's where the cost story becomes visible.
Your next steps to control CAC
A founder reviews CAC in the board pack, sees a number that looks manageable, and pushes for more spend. Two weeks later, pipeline is up, cash burn is up, and nothing about payback feels better. That usually happens because the company is still managing a partial CAC number instead of the fully loaded one.
Start in the CRM and in the general ledger. Reconcile one closed-won cohort and one lost cohort from the last 30 to 60 days. If marketing spend says €40,000 but the motion also consumed SDR time, AE time, sales tools, enrichment credits, contractor support, and management overhead, the reported CAC is not wrong by a little. It is directionally wrong.
Do these three operational checks this week
Rebuild CAC with full cost allocation
Pull paid media, software, agencies, SDR salaries, AE salaries tied to new business, sales management allocation, data vendors, and a fair share of overhead into one model. If finance and RevOps cannot trace the inputs, treat the CAC number as incomplete.Add a "signal source" field in HubSpot by Monday
Every outbound opportunity should show what triggered outreach: hiring event, funding round, product usage signal, inbound revisit, partner referral, or list-based prospecting. If the source is blank, the team cannot tell whether conversion came from targeting quality or rep effort.Audit held-meeting rate by source, not just booked meetings
Booked meetings make weak channels look healthy. Held rate shows whether the account was qualified enough to deserve calendar time from an SDR or AE.
One more check separates disciplined teams from noisy ones. Compare CAC by source at the sales-accepted pipeline level, not at lead or meeting level. A channel that creates cheap meetings can still produce expensive revenue if opportunities stall, require extra calls, or need heavy AE rescue.
Tighten execution where CAC usually leaks
Three changes tend to cut waste fast:
Speed up reply handling
Route replies from Apollo, Lemlist, Smartlead, or Instantly into Slack and CRM ownership rules so an AE can respond while intent is still live. Slow handoff creates preventable no-shows and lower conversion on opportunities you already paid to generate.Use short personalized video late in the cycle
A focused Loom for the buying committee can reduce repeat explanation work from AEs. Keep it tied to the prospect's workflow, rollout risk, and expected outcome, not a generic product tour.Measure social with pipeline rules, not engagement screenshots
If social sits anywhere in your acquisition mix, use these social media return on investment methods to connect activity to sourced pipeline, influenced pipeline, and closed-won revenue.
The next useful CAC conversation is not "how do we get the number down?" It is "which stage is making expensive people spend time on work that should have been filtered out earlier?"
Run the held-rate audit this Friday. Add the signal-source field by Monday. Then review one month of opportunities and cut the sources that create motion without creating sales-accepted pipeline.
Grou helps B2B teams build pipeline systems that turn attention into qualified conversations across SaaS, iGaming, manufacturing, legal tech, and pharma. The work runs through one reporting line, shared execution sprints, and a single revenue engine built around list quality, message fit, fast routing, and clean attribution, see Grou.
You already have a CAC number in your dashboard. The problem is you probably can't trust it. If your team is dividing ad spend by closed customers, or even sales and marketing spend without loaded labor and overhead, you're making allocation decisions on a partial cost model while trying to scale in a market where acquisition has gotten more expensive.
Full-cost CAC is the only version worth using for planning headcount, channel mix, and runway.
Benchmarks only help after you calculate CAC the same way every month or quarter.
A real campaign can look healthy or broken depending on whether you include labor, tools, and overhead.
Personnel cost usually drives CAC hardest, so fixing productivity matters more than shaving a tool bill.
Signal-triggered intake is the structural move that cuts waste before reps burn hours on bad pipeline.
Table of Contents
The full-cost formula for CAC and why most are wrong
Many organizations understate SaaS customer acquisition cost because they exclude the expensive parts that sit outside media spend. That's convenient for reporting. It's terrible for decision-making.
The formula we actually use
The version worth tracking is simple:
CAC = total sales and marketing spend in a period / new customers acquired in the same period
The important part is what goes into "total sales and marketing spend." For an honest number, include:
Direct acquisition spend → paid media, acquisition content, events, conference travel, agency fees
Tooling → HubSpot, Apollo, Clay, Sales Navigator, Lemlist, Instantly, Smartlead, HeyReach, enrichment and verification
Loaded personnel → AEs, SDRs, marketing, sales ops, marketing ops, enablement, and the share of CRO, CMO, or CEO time spent on acquisition
Allocated overhead → office cost for revenue teams, shared software, recruiting for sales and marketing hires, contract-related legal cost
What stays out matters too. Customer success belongs in retention math. Product development isn't acquisition. Brand work with no direct acquisition intent should sit in a separate bucket.
Why narrow CAC creates bad decisions
The usual shortcut is paid media divided by customers. The slightly better shortcut is ad spend plus software. Both miss the largest operating reality in B2B revenue teams, people cost.
That blind spot gets worse when pipeline quality is weak. Data cited in this analysis of unqualified pipeline distorting CAC shows 60–70% of B2B SaaS leads from outbound or paid channels are disqualified before sales engagement, which means reported CAC can be 2–3x lower than the true cost of acquiring a viable prospect.
Practical rule: If your CAC excludes the cost of the people who generated, qualified, chased, and closed the customer, it isn't a business metric. It's a media metric.
This is also why attribution discipline matters. Blended CAC should be the primary number, then channel views can sit underneath it with first-touch, last-touch, or multi-touch context. If your attribution is messy, start by cleaning the reporting line before you start defending channel budgets. This guide on multi-touch attribution for B2B teams is useful if your CRM still credits the final touch with all the work.
For teams trying to reduce wasted spend before they rebuild reporting, this resource on Lowering acquisition spend for marketers is worth scanning because it pushes you toward channel discipline rather than vanity efficiency.
SaaS CAC benchmarks for 2026
Here's the verdict up front. Don't benchmark your number against a generic SaaS average and call it done. Compare it against your sales model, your ACV range, your payback profile, and your LTV:CAC ratio. Otherwise you'll either panic too early or miss a serious problem.
What the market is telling you
Projected 2026 benchmark data shows the median B2B SaaS CAC has a 16x divergence by sales model, $702 for self-serve versus $11,400 for sales-led acquisition, with SMB-focused SaaS usually landing around $500–$750 and enterprise motions at $6,000–$15,000+ according to Digital Applied's benchmark review. That's the cleanest proof that one headline average is almost useless.
The same issue shows up at industry level. The average B2B SaaS CAC is described as roughly $1,200 per customer in 2025, with a jump of 40–60% between 2023 and 2025, and enterprise acquisitions ranging from $6,000 to over $15,000 in the GTM8020 benchmark roundup. If you're selling into legal tech, pharma, manufacturing, or a mid-market SaaS buyer with committee review, you shouldn't compare yourself to a self-serve product-led motion.
A second market signal matters even more for finance planning. The median SaaS company is projected to spend $2.00 to acquire every $1.00 of new ARR in 2026, up from $1.83 in 2023, while the top quartile spends $1.00 and the bottom quartile spends $2.82 for the same dollar of ARR in the Amra and Elma SaaS acquisition report.
The ratios that matter more than the headline CAC
A standalone CAC figure is blunt. The ratio set tells you whether the machine works.
Metric | Healthy read | Why it matters |
|---|---|---|
LTV:CAC | At least 3:1 | Below that, the business is paying too much for what the customer returns |
CAC payback | Under 12 months is healthy for B2B SaaS | It tells you how long cash stays tied up before a customer becomes profitable |
Spend per new ARR | Lower is better, with large spread across quartiles | It reveals whether growth is efficient or funded by burn |
Usermaven's benchmark on healthy CLV to CAC economics is blunt on this point. A healthy SaaS business should target at least a 3:1 CLV:CAC ratio.
For payback, the projected benchmark from B2B SaaS CAC payback data puts the median B2B SaaS recovery period at 8.6 months, and anything under 12 months is considered healthy. If you need another reference point for that metric, this breakdown of CAC payback period benchmarks is a practical companion when you're modeling runway.
If you're a founder, don't ask whether CAC is "good." Ask whether cash comes back fast enough, and whether the customer returns enough gross profit to justify the sales motion.
A real-world CAC breakdown from a €180k campaign
A fully-loaded model only matters if it changes what you see. Here's a campaign where it did.
What went into the spend
This was a six-month B2B SaaS engagement in the revenue operations category, aimed at heads of RevOps at companies with 100 to 500 employees. The average ACV was €42k.
The total acquisition investment was €180,050. It broke down like this:
Agency spend → €45,000
Allocated tool cost → roughly €38,000 across Clay, Apollo, Sales Navigator, Lemlist, HeyReach, HubSpot, verification, and Loom
Allocated personnel cost → roughly €54,850 across one AE, one SDR, CEO time, and a marketing coordinator
Paid media → €34,000 across LinkedIn Ads, Google Ads, and Meta retargeting
Overhead → roughly €8,200
The campaign produced 78 qualified meetings, 47 qualified opportunities, and 7 closed-won deals during the engagement, plus 3 additional closed-won deals in the following 90 days from pipeline created during the period. Total attributable outcome was 10 customers and roughly €420k ARR.
What the math looks like depending on honesty level
Using full-cost CAC:
Calculation view | Math | Result |
|---|---|---|
Fully-loaded blended CAC | €180,050 / 10 | €18,005 |
Direct-spend-only CAC | €117,000 / 10 | €11,700 |
Paid-media-only CAC | €34,000 / 10 | €3,400 |
This is the whole argument in one table. Same campaign. Same customers. Three different stories.
The €18,005 number is the one you can use for planning because it reflects what the company spent to create those customers. The €11,700 number is incomplete. The €3,400 number is almost decorative.
There was another reason this campaign held up under scrutiny. The economics behind the CAC were strong enough to justify the motion:
CAC to ACV ratio → 43% of first-year ACV
CAC payback → 6.9 months, based on roughly €31,500 annual gross profit per customer and roughly €2,625 monthly gross profit
LTV to CAC ratio → 6.1x, based on roughly €110,250 lifetime gross profit per customer
"Paid-media CAC can help you compare channels. It can't tell you whether the business is buying growth profitably."
A few execution choices helped. Signal-triggered intake improved prospect quality. The mix of LinkedIn, email, founder content, and selective paid media worked as one system instead of four separate campaigns. Personalized Loom at proposal stage helped compress cycle time. Fast reply routing made it easier to capture interest while it was still warm.
If you want to compare that kind of full-funnel thinking against another structured B2B motion, this market entry and lead generation case study for an automotive retail SaaS platform is a useful reference.
The primary drivers of high CAC
High CAC usually gets blamed on LinkedIn CPCs, bad ad creative, or expensive tools. That's not where I start. In most B2B SaaS environments, the bigger issue is how many human hours the company burns to produce one customer.
Why labor dominates the number
Across full-cost CAC models, personnel costs typically represent 50 to 70% of total CAC. That includes AE time, SDR work, marketing execution, RevOps support, enablement, and executive involvement in pipeline creation and deal progression.
Once you accept that, the operating question changes. You stop asking, "Can we cut software spend?" and start asking, "Why does it take this many AE hours to close a deal?"
That matters more in categories like SaaS, manufacturing, legal tech, pharma, and iGaming B2B partnerships where sales cycles involve more stakeholders, more validation, and more custom follow-up.
What usually makes CAC spike
A few patterns show up again and again:
Weak meeting quality means AEs spend time on calls that should never have been booked.
Slow follow-up lets interested buyers cool off before the account team gets involved.
Static list-building floods the top of funnel with accounts that fit the ICP on paper but show no buying motion.
Overuse of paid social pushes spend up before messaging and qualification are tight. For context, channel CAC benchmarks cite $150 per customer for referrals, $480 for content/SEO, and more than $2,000 for LinkedIn ads.
If your LTV:CAC ratio is under the 3:1 threshold covered in the earlier benchmark section, that's a red flag, not a timing issue. This review of LinkedIn ad costs in B2B demand generation is useful when the paid side is soaking up budget but sales productivity still isn't where it needs to be.
The practical point is simple. CAC doesn't stay high because software is expensive. It stays high because teams allow low-intent pipeline to consume expensive labor.
How to cut your SaaS CAC by 30-50 percent
The move I recommend first is clear. Replace static list-building with signal-triggered intake. For most outbound-heavy SaaS teams, that's the fastest structural fix because it improves timing before reps waste hours on poor-fit accounts.
Replace static lists with signal-triggered intake
In practice, this means your outbound queue isn't just "accounts that match the ICP." It's accounts that match the ICP and show a live reason to buy.
The signals worth monitoring depend on category, but common ones include:
Job changes → new VP Sales, new Head of RevOps, new demand gen lead
Funding or expansion events → budget changes often precede system changes
Hiring patterns → active hiring for BDRs, RevOps, QA, regulatory, or compliance roles
Tool-stack changes → a fresh install or replacement signal often opens a wedge
Public pain statements → LinkedIn posts, webinars, event panels, and comment threads
A Clay-led setup usually does the monitoring and enrichment. Apollo can support contact and account data. Sales Navigator helps validate account movement. Lemlist, Instantly, Smartlead, or HeyReach can handle execution depending on your sequencing model. HubSpot should remain the source of truth.
Build the system in the tools your team already uses
The operating sequence is straightforward:
Map closed-won patterns
Pull recent wins from HubSpot. Look for repeated buying triggers, not just firmographic fit.Create signal fields at account and contact level
Add columns for signal type, signal date, source, owner, and message angle.Set routing rules
High-intent signals should route fast. Low-confidence signals can enter a slower sequence or stay in monitoring.Write trigger-based messaging
Outreach should reference the signal naturally. If the reason for contact isn't obvious in the first lines, the signal wasn't useful enough.Review held-meeting quality weekly
Don't judge the system on reply rate alone. Watch held rate, opportunity creation, and sales acceptance.
The reason this works is timing. Better timing raises conversion and reduces wasted labor. The verified data point worth paying attention to here is from Ratiotech's write-up on AI and CAC trade-offs. It notes that AI-personalized outbound can raise CAC by 15–25% early on because tooling and data costs go up, yet it can improve lead-to-meeting conversion by 40%, with lifetime CAC getting more efficient only after 6+ months.
That trade-off matters. Teams often add AI tooling and expect instant CAC relief. Early on, cost can rise. The payoff comes when better prospect selection and better messaging reduce labor waste across the funnel.
For proposal-stage acceleration, product walkthroughs help too. If your AEs still explain the product from scratch in every late-stage call, this effective product demo video guide is a practical companion.
A short walkthrough helps frame the mechanics in context:
If you need the KPI layer around this system, this lead generation KPI framework is the place to tighten measurement. Watch response speed, held rate, opportunity rate, and close rate by signal class. That's where the cost story becomes visible.
Your next steps to control CAC
A founder reviews CAC in the board pack, sees a number that looks manageable, and pushes for more spend. Two weeks later, pipeline is up, cash burn is up, and nothing about payback feels better. That usually happens because the company is still managing a partial CAC number instead of the fully loaded one.
Start in the CRM and in the general ledger. Reconcile one closed-won cohort and one lost cohort from the last 30 to 60 days. If marketing spend says €40,000 but the motion also consumed SDR time, AE time, sales tools, enrichment credits, contractor support, and management overhead, the reported CAC is not wrong by a little. It is directionally wrong.
Do these three operational checks this week
Rebuild CAC with full cost allocation
Pull paid media, software, agencies, SDR salaries, AE salaries tied to new business, sales management allocation, data vendors, and a fair share of overhead into one model. If finance and RevOps cannot trace the inputs, treat the CAC number as incomplete.Add a "signal source" field in HubSpot by Monday
Every outbound opportunity should show what triggered outreach: hiring event, funding round, product usage signal, inbound revisit, partner referral, or list-based prospecting. If the source is blank, the team cannot tell whether conversion came from targeting quality or rep effort.Audit held-meeting rate by source, not just booked meetings
Booked meetings make weak channels look healthy. Held rate shows whether the account was qualified enough to deserve calendar time from an SDR or AE.
One more check separates disciplined teams from noisy ones. Compare CAC by source at the sales-accepted pipeline level, not at lead or meeting level. A channel that creates cheap meetings can still produce expensive revenue if opportunities stall, require extra calls, or need heavy AE rescue.
Tighten execution where CAC usually leaks
Three changes tend to cut waste fast:
Speed up reply handling
Route replies from Apollo, Lemlist, Smartlead, or Instantly into Slack and CRM ownership rules so an AE can respond while intent is still live. Slow handoff creates preventable no-shows and lower conversion on opportunities you already paid to generate.Use short personalized video late in the cycle
A focused Loom for the buying committee can reduce repeat explanation work from AEs. Keep it tied to the prospect's workflow, rollout risk, and expected outcome, not a generic product tour.Measure social with pipeline rules, not engagement screenshots
If social sits anywhere in your acquisition mix, use these social media return on investment methods to connect activity to sourced pipeline, influenced pipeline, and closed-won revenue.
The next useful CAC conversation is not "how do we get the number down?" It is "which stage is making expensive people spend time on work that should have been filtered out earlier?"
Run the held-rate audit this Friday. Add the signal-source field by Monday. Then review one month of opportunities and cut the sources that create motion without creating sales-accepted pipeline.
Grou helps B2B teams build pipeline systems that turn attention into qualified conversations across SaaS, iGaming, manufacturing, legal tech, and pharma. The work runs through one reporting line, shared execution sprints, and a single revenue engine built around list quality, message fit, fast routing, and clean attribution, see Grou.

Pipeline OS Newsletter
Build qualified pipeline
Get weekly tactics to generate demand, improve lead quality, and book more meetings.





Trusted by industry leaders
Trusted by industry leaders
Trusted by industry leaders
Ready to build qualified pipeline?
Ready to build qualified pipeline?
Ready to build qualified pipeline?
Book a call to see if we're the right fit, or take the 2-minute quiz to get a clear starting point.
Book a call to see if we're the right fit, or take the 2-minute quiz to get a clear starting point.
Book a call to see if we're the right fit, or take the 2-minute quiz to get a clear starting point.
" height="30.21639343089746px" id="hfGbXmQR2" width="30.216393430897455px"/></svg>)
Copyright © 2026 – All Right Reserved
Copyright © 2026 – All Right Reserved
Copyright © 2026 – All Right Reserved