%22%3E%3C/path%3E%3Cpath d=%22M 63.072 7.554 C 62.258 8.022 61.577 8.689 61.092 9.493 L 61.092 7.076 L 57.158 7.076 L 57.158 22.64 L 61.089 22.64 L 61.089 14.888 C 61.089 13.446 61.403 12.434 62.03 11.853 C 62.818 11.218 63.818 10.907 64.826 10.982 L 65.868 10.982 L 65.868 6.851 C 64.891 6.834 63.926 7.076 63.073 7.554 Z%22 fill=%22rgb(17,17,17)%22%3E%3C/path%3E%3Cpath d=%22M 78.916 7.82 C 76.363 6.49 73.321 6.49 70.768 7.82 C 69.562 8.473 68.564 9.451 67.888 10.644 C 67.167 11.931 66.803 13.387 66.834 14.862 C 66.804 16.332 67.157 17.785 67.86 19.077 C 68.515 20.267 69.494 21.246 70.684 21.901 C 71.924 22.576 73.318 22.92 74.73 22.898 C 76.164 22.918 77.58 22.575 78.846 21.901 C 80.062 21.247 81.073 20.27 81.768 19.077 C 82.506 17.797 82.88 16.339 82.85 14.862 C 82.88 13.389 82.517 11.934 81.797 10.647 C 81.12 9.455 80.122 8.477 78.917 7.824 M 78.803 14.862 C 78.829 15.739 78.636 16.608 78.241 17.391 C 77.903 18.046 77.38 18.588 76.738 18.95 C 76.124 19.293 75.432 19.472 74.729 19.47 C 73.668 19.497 72.648 19.061 71.934 18.276 C 71.139 17.323 70.741 16.1 70.823 14.862 C 70.741 13.62 71.149 12.395 71.959 11.45 C 72.687 10.667 73.715 10.233 74.783 10.256 C 75.859 10.236 76.894 10.67 77.635 11.45 C 78.464 12.387 78.884 13.616 78.801 14.864%22 fill=%22rgb(17,17,17)%22%3E%3C/path%3E%3Cpath d=%22M 95.906 7.076 L 95.906 15.646 C 95.975 16.68 95.643 17.701 94.979 18.498 C 94.311 19.184 93.379 19.547 92.422 19.495 C 91.475 19.544 90.553 19.18 89.894 18.498 C 89.23 17.701 88.898 16.68 88.967 15.646 L 88.967 7.076 L 85.033 7.076 L 85.033 16.207 C 85 17.449 85.275 18.68 85.834 19.79 C 86.327 20.75 87.095 21.542 88.039 22.065 C 89.033 22.594 90.145 22.861 91.271 22.838 C 92.188 22.847 93.095 22.65 93.926 22.263 C 94.708 21.905 95.388 21.36 95.906 20.675 L 95.906 22.645 L 99.865 22.645 L 99.865 7.076 Z%22 fill=%22rgb(17,17,17)%22%3E%3C/path%3E%3Cpath d=%22M 4.513 15.626 C 4.511 10.815 7.606 6.549 12.181 5.059 C 16.756 3.57 21.77 5.195 24.601 9.086 L 27.816 5.87 C 24.074 1.186 17.981 -0.943 12.137 0.393 C 6.292 1.728 1.728 6.292 0.393 12.137 C -0.943 17.981 1.186 24.074 5.87 27.816 L 9.085 24.601 C 6.214 22.512 4.515 19.177 4.513 15.626%22 fill=%22rgb(32,62,235)%22%3E%3C/path%3E%3Cpath d=%22M 17.114 14.343 L 13.354 18.01 L 13.354 18.026 L 21.071 18.026 L 11.412 27.609 L 17.389 27.609 L 23.999 21.081 L 23.999 28.316 L 24.005 28.316 L 27.967 24.393 L 27.967 14.343 Z%22 fill=%22rgb(32,62,235)%22%3E%3C/path%3E%3C/g%3E%3C/svg%3E) ×
× ××
××›
›
›
›
TAM SAM SOM calculation for B2B: formulas + worked example
TAM SAM SOM calculation for B2B: formulas + worked example
TAM SAM SOM calculation for B2B: formulas + worked example
TAM SAM SOM calculation for B2B: formulas + worked example
TAM SAM SOM calculation for B2B: formulas + worked example
TAM SAM SOM calculation for B2B: formulas + worked example

Author
Aljaz Peklaj

TAM, SAM, and SOM answer three different questions: how big the market could be, how much of it your product can actually serve, and how much you can realistically win in the next few years. Most B2B decks get the first number impressively wrong and the third one embarrassingly vague. This guide gives the formulas, the bottom-up method that survives due diligence, a fully worked B2B example, and the data sources to build each number from.
The numbers downstream of market sizing live in our B2B SaaS pipeline benchmarks and CAC payback benchmarks.
TL;DR
Calculate all three bottom-up: TAM = total target accounts x achievable annual contract value, SAM = the subset your product, language, geography, and channel can actually serve x ACV, and SOM = the share your sales capacity can win in 2-3 years, built from rep math rather than a plucked percentage. Worked example below: 40,000 target agencies x $3,600 ACV gives a $144M TAM, ICP filters cut it to a $43M SAM, and a two-rep capacity model yields roughly $1.3M ARR in year three, about 3% of SAM. Top-down sizing from analyst reports is context, not evidence: investors and operators both trust the count-times-price build, and account counts are pullable in an afternoon from LinkedIn and B2B databases.
The three numbers, defined properly
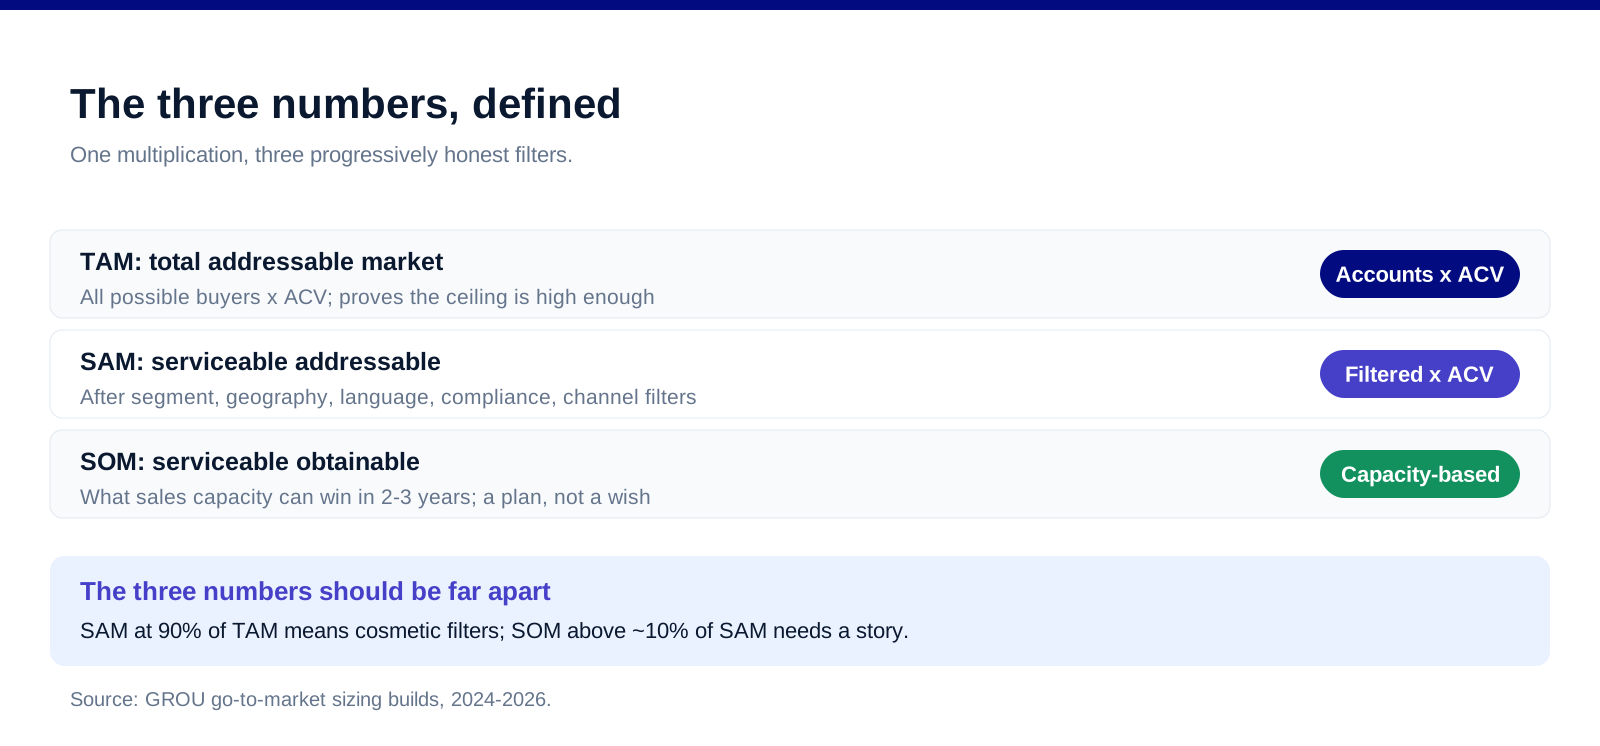
TAM, total addressable market. Everyone who could conceivably buy the category, times what they would pay annually: total accounts x ACV. It sizes the prize if you had no constraints, and its job is to prove the ceiling is high enough to matter.
SAM, serviceable addressable market. The TAM after your real constraints: segment, geography, language, compliance, deployment model, channel reach. This is the market your current product can sell into, and it is the number your go-to-market plan should be built against.
SOM, serviceable obtainable market. What you can win in a defined window, usually 2-3 years. The credible version is built from sales capacity and win rates, not from "1% of the market": capacity-based SOM is a plan, percentage-based SOM is a wish.
Top-down vs bottom-up: use both, trust one
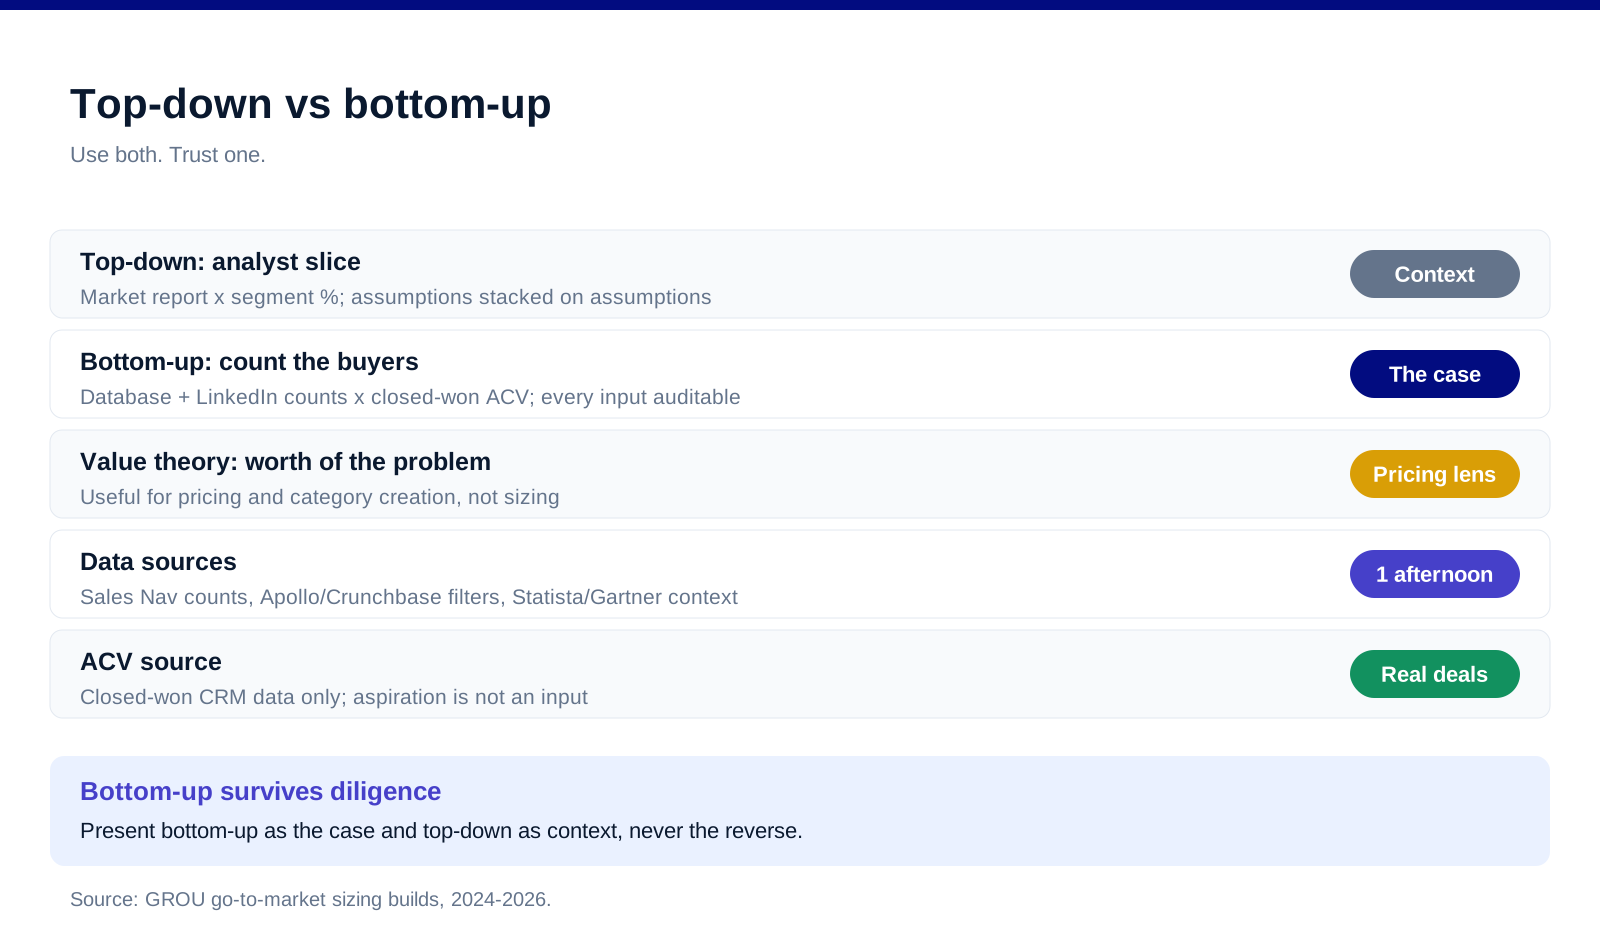
Top-down starts from an analyst market figure and slices downward ("the market is $12B, our segment is 8%..."). Fast, citable, and structurally flattering, because every slice is an assumption stacked on someone else's assumption. Use analyst data from Statista, Gartner, or vendor intelligence platforms like HG Insights as context and sanity check.
Bottom-up counts the actual buyers: how many companies fit the profile, times what each pays. Slower, defensible, and the version that survives investor diligence and board scrutiny, because every input can be audited. The account counts are an afternoon of work: LinkedIn Sales Navigator filters give company counts by industry, headcount, and geography, Apollo and Crunchbase give firmographic counts and funding filters, and your own closed-won data gives the honest ACV.
Value-theory sizing (what would the solved problem be worth?) is useful for pricing strategy and category creation, less so for sizing; our B2B SaaS pricing strategy guide covers that lens.
The worked example, end to end
Product: a deliverability monitoring platform sold to B2B agencies at $300/month, $3,600 ACV.
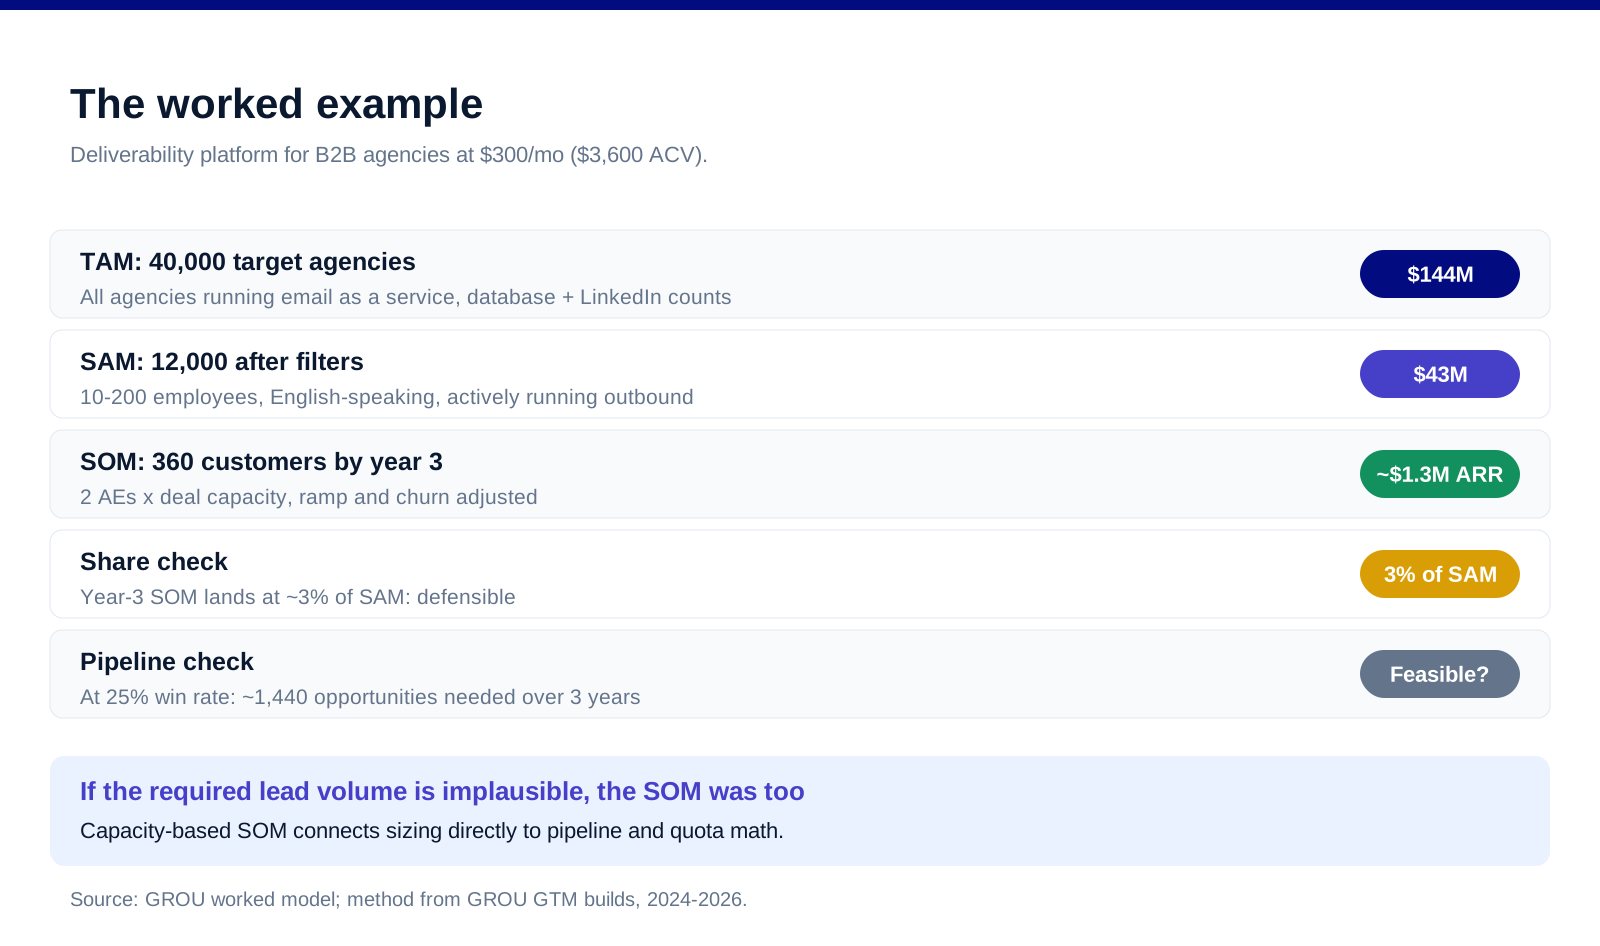
Step 1, TAM. Database and LinkedIn counts find roughly 40,000 marketing and lead-gen agencies in the target regions that run email as a service. TAM = 40,000 x $3,600 = $144M. Honest, and honestly the least useful number of the three.
Step 2, SAM. Apply the real filters: 10-200 employees (below that they will not pay, above that they build in-house), English-speaking markets, actively running cold outbound (observable via job posts and tech signals). The count drops to ~12,000 accounts. SAM = 12,000 x $3,600 = $43M.
Step 3, SOM from capacity, not vibes. Two AEs, each closing five deals a month at steady state, is ~120 new customers a year; with ramp and churn, call it 360 customers by end of year three. SOM = 360 x $3,600 = ~$1.3M ARR, roughly 3% of SAM. That number connects directly to pipeline math: at a 25% win rate it implies ~1,440 opportunities over three years, which your MQL-to-SQL conversion rates translate into a required lead volume. If the required lead volume is implausible, the SOM was too.
The sanity checks. ACV comes from closed-won data, not aspiration. The account count excludes companies that structurally cannot buy (wrong stack, wrong compliance regime). And the three numbers should be far apart: a SAM that is 90% of TAM means the filters were cosmetic, a SOM above ~10% of SAM in three years needs an extraordinary distribution story to defend.
Where each number actually gets used
TAM belongs in fundraising narratives and category bets: it answers "is the ceiling high enough". SAM drives go-to-market design: ICP definition, territory planning, channel budgets, and whether the pipeline math in your plan is physically possible. SOM sets the revenue plan, headcount model, and quota capacity, and connects sizing to strategy choices like ABM tiers (a small SAM of high-ACV accounts wants ABM; a wide SAM of small accounts wants volume motions per our GTM motion comparison). Re-run the build yearly: ACV moves, filters sharpen, and a sizing model that never changes is a sizing model nobody uses.
FAQ
What is the difference between TAM, SAM and SOM?
TAM is total demand for the category (all possible buyers x ACV), SAM is the portion your product and channels can actually serve after segment, geography, and capability filters, and SOM is the share you can realistically win in 2-3 years given sales capacity and win rates.
How do you calculate TAM bottom-up?
Count the companies that fit your buyer profile using database and LinkedIn filters, then multiply by an achievable annual contract value taken from real closed-won data. Bottom-up TAM = target accounts x ACV, with every input auditable.
What percentage of SAM should SOM be?
There is no magic percentage: build SOM from sales capacity (reps x deals per rep x timeframe, adjusted for ramp and churn) and then express it as a share of SAM. In practice credible three-year SOMs often land in the low single digits of SAM; above ~10% requires an unusual distribution advantage to defend.
What data sources work for B2B market sizing?
LinkedIn Sales Navigator for company counts by size, industry, and geography; Apollo or similar B2B databases for firmographic and technographic filters; Crunchbase for funding-stage cuts; Statista, Gartner, and market intelligence platforms for top-down context; and your own CRM for the only ACV that matters.
Is top-down or bottom-up market sizing better?
Bottom-up is the number people trust, because accounts-times-price can be audited input by input. Top-down is useful as a sanity check and for citing market momentum. Present bottom-up as the case and top-down as the context, never the reverse.
How often should you recalculate TAM SAM SOM?
Yearly as a rhythm, and immediately after anything that changes the filters: a new product line, a new geography, a pricing change, or a pivot in ICP. SAM and SOM move much faster than TAM, and they are the two numbers your plan actually runs on.
Bottom line
TAM SAM SOM done right is one multiplication done three times with progressively honest filters: all accounts x ACV, serviceable accounts x ACV, winnable accounts x ACV. Build it bottom-up, source the counts from databases you can re-run, derive SOM from rep capacity, and let the three numbers drive fundraising, go-to-market design, and the revenue plan respectively.
Want the sizing wired into an actual pipeline plan, from account counts to quota math? Book a call with GROU. We build go-to-market engines for B2B companies across verticals.
We are GROU, a B2B pipeline agency that runs lead generation, outbound, and LinkedIn content for clients across manufacturing, fintech, iGaming, software, and professional services. The sizing method reflects the market builds we run for client go-to-market plans between 2024 and 2026, anonymized to protect client confidentiality.
Some links in this article are affiliate. We may earn a small commission at no extra cost to you. We only recommend tools we've deployed for clients.
TAM, SAM, and SOM answer three different questions: how big the market could be, how much of it your product can actually serve, and how much you can realistically win in the next few years. Most B2B decks get the first number impressively wrong and the third one embarrassingly vague. This guide gives the formulas, the bottom-up method that survives due diligence, a fully worked B2B example, and the data sources to build each number from.
The numbers downstream of market sizing live in our B2B SaaS pipeline benchmarks and CAC payback benchmarks.
TL;DR
Calculate all three bottom-up: TAM = total target accounts x achievable annual contract value, SAM = the subset your product, language, geography, and channel can actually serve x ACV, and SOM = the share your sales capacity can win in 2-3 years, built from rep math rather than a plucked percentage. Worked example below: 40,000 target agencies x $3,600 ACV gives a $144M TAM, ICP filters cut it to a $43M SAM, and a two-rep capacity model yields roughly $1.3M ARR in year three, about 3% of SAM. Top-down sizing from analyst reports is context, not evidence: investors and operators both trust the count-times-price build, and account counts are pullable in an afternoon from LinkedIn and B2B databases.
The three numbers, defined properly
TAM, total addressable market. Everyone who could conceivably buy the category, times what they would pay annually: total accounts x ACV. It sizes the prize if you had no constraints, and its job is to prove the ceiling is high enough to matter.
SAM, serviceable addressable market. The TAM after your real constraints: segment, geography, language, compliance, deployment model, channel reach. This is the market your current product can sell into, and it is the number your go-to-market plan should be built against.
SOM, serviceable obtainable market. What you can win in a defined window, usually 2-3 years. The credible version is built from sales capacity and win rates, not from "1% of the market": capacity-based SOM is a plan, percentage-based SOM is a wish.
Top-down vs bottom-up: use both, trust one
Top-down starts from an analyst market figure and slices downward ("the market is $12B, our segment is 8%..."). Fast, citable, and structurally flattering, because every slice is an assumption stacked on someone else's assumption. Use analyst data from Statista, Gartner, or vendor intelligence platforms like HG Insights as context and sanity check.
Bottom-up counts the actual buyers: how many companies fit the profile, times what each pays. Slower, defensible, and the version that survives investor diligence and board scrutiny, because every input can be audited. The account counts are an afternoon of work: LinkedIn Sales Navigator filters give company counts by industry, headcount, and geography, Apollo and Crunchbase give firmographic counts and funding filters, and your own closed-won data gives the honest ACV.
Value-theory sizing (what would the solved problem be worth?) is useful for pricing strategy and category creation, less so for sizing; our B2B SaaS pricing strategy guide covers that lens.
The worked example, end to end
Product: a deliverability monitoring platform sold to B2B agencies at $300/month, $3,600 ACV.
Step 1, TAM. Database and LinkedIn counts find roughly 40,000 marketing and lead-gen agencies in the target regions that run email as a service. TAM = 40,000 x $3,600 = $144M. Honest, and honestly the least useful number of the three.
Step 2, SAM. Apply the real filters: 10-200 employees (below that they will not pay, above that they build in-house), English-speaking markets, actively running cold outbound (observable via job posts and tech signals). The count drops to ~12,000 accounts. SAM = 12,000 x $3,600 = $43M.
Step 3, SOM from capacity, not vibes. Two AEs, each closing five deals a month at steady state, is ~120 new customers a year; with ramp and churn, call it 360 customers by end of year three. SOM = 360 x $3,600 = ~$1.3M ARR, roughly 3% of SAM. That number connects directly to pipeline math: at a 25% win rate it implies ~1,440 opportunities over three years, which your MQL-to-SQL conversion rates translate into a required lead volume. If the required lead volume is implausible, the SOM was too.
The sanity checks. ACV comes from closed-won data, not aspiration. The account count excludes companies that structurally cannot buy (wrong stack, wrong compliance regime). And the three numbers should be far apart: a SAM that is 90% of TAM means the filters were cosmetic, a SOM above ~10% of SAM in three years needs an extraordinary distribution story to defend.
Where each number actually gets used
TAM belongs in fundraising narratives and category bets: it answers "is the ceiling high enough". SAM drives go-to-market design: ICP definition, territory planning, channel budgets, and whether the pipeline math in your plan is physically possible. SOM sets the revenue plan, headcount model, and quota capacity, and connects sizing to strategy choices like ABM tiers (a small SAM of high-ACV accounts wants ABM; a wide SAM of small accounts wants volume motions per our GTM motion comparison). Re-run the build yearly: ACV moves, filters sharpen, and a sizing model that never changes is a sizing model nobody uses.
FAQ
What is the difference between TAM, SAM and SOM?
TAM is total demand for the category (all possible buyers x ACV), SAM is the portion your product and channels can actually serve after segment, geography, and capability filters, and SOM is the share you can realistically win in 2-3 years given sales capacity and win rates.
How do you calculate TAM bottom-up?
Count the companies that fit your buyer profile using database and LinkedIn filters, then multiply by an achievable annual contract value taken from real closed-won data. Bottom-up TAM = target accounts x ACV, with every input auditable.
What percentage of SAM should SOM be?
There is no magic percentage: build SOM from sales capacity (reps x deals per rep x timeframe, adjusted for ramp and churn) and then express it as a share of SAM. In practice credible three-year SOMs often land in the low single digits of SAM; above ~10% requires an unusual distribution advantage to defend.
What data sources work for B2B market sizing?
LinkedIn Sales Navigator for company counts by size, industry, and geography; Apollo or similar B2B databases for firmographic and technographic filters; Crunchbase for funding-stage cuts; Statista, Gartner, and market intelligence platforms for top-down context; and your own CRM for the only ACV that matters.
Is top-down or bottom-up market sizing better?
Bottom-up is the number people trust, because accounts-times-price can be audited input by input. Top-down is useful as a sanity check and for citing market momentum. Present bottom-up as the case and top-down as the context, never the reverse.
How often should you recalculate TAM SAM SOM?
Yearly as a rhythm, and immediately after anything that changes the filters: a new product line, a new geography, a pricing change, or a pivot in ICP. SAM and SOM move much faster than TAM, and they are the two numbers your plan actually runs on.
Bottom line
TAM SAM SOM done right is one multiplication done three times with progressively honest filters: all accounts x ACV, serviceable accounts x ACV, winnable accounts x ACV. Build it bottom-up, source the counts from databases you can re-run, derive SOM from rep capacity, and let the three numbers drive fundraising, go-to-market design, and the revenue plan respectively.
Want the sizing wired into an actual pipeline plan, from account counts to quota math? Book a call with GROU. We build go-to-market engines for B2B companies across verticals.
We are GROU, a B2B pipeline agency that runs lead generation, outbound, and LinkedIn content for clients across manufacturing, fintech, iGaming, software, and professional services. The sizing method reflects the market builds we run for client go-to-market plans between 2024 and 2026, anonymized to protect client confidentiality.
Some links in this article are affiliate. We may earn a small commission at no extra cost to you. We only recommend tools we've deployed for clients.
TAM, SAM, and SOM answer three different questions: how big the market could be, how much of it your product can actually serve, and how much you can realistically win in the next few years. Most B2B decks get the first number impressively wrong and the third one embarrassingly vague. This guide gives the formulas, the bottom-up method that survives due diligence, a fully worked B2B example, and the data sources to build each number from.
The numbers downstream of market sizing live in our B2B SaaS pipeline benchmarks and CAC payback benchmarks.
TL;DR
Calculate all three bottom-up: TAM = total target accounts x achievable annual contract value, SAM = the subset your product, language, geography, and channel can actually serve x ACV, and SOM = the share your sales capacity can win in 2-3 years, built from rep math rather than a plucked percentage. Worked example below: 40,000 target agencies x $3,600 ACV gives a $144M TAM, ICP filters cut it to a $43M SAM, and a two-rep capacity model yields roughly $1.3M ARR in year three, about 3% of SAM. Top-down sizing from analyst reports is context, not evidence: investors and operators both trust the count-times-price build, and account counts are pullable in an afternoon from LinkedIn and B2B databases.
The three numbers, defined properly
TAM, total addressable market. Everyone who could conceivably buy the category, times what they would pay annually: total accounts x ACV. It sizes the prize if you had no constraints, and its job is to prove the ceiling is high enough to matter.
SAM, serviceable addressable market. The TAM after your real constraints: segment, geography, language, compliance, deployment model, channel reach. This is the market your current product can sell into, and it is the number your go-to-market plan should be built against.
SOM, serviceable obtainable market. What you can win in a defined window, usually 2-3 years. The credible version is built from sales capacity and win rates, not from "1% of the market": capacity-based SOM is a plan, percentage-based SOM is a wish.
Top-down vs bottom-up: use both, trust one
Top-down starts from an analyst market figure and slices downward ("the market is $12B, our segment is 8%..."). Fast, citable, and structurally flattering, because every slice is an assumption stacked on someone else's assumption. Use analyst data from Statista, Gartner, or vendor intelligence platforms like HG Insights as context and sanity check.
Bottom-up counts the actual buyers: how many companies fit the profile, times what each pays. Slower, defensible, and the version that survives investor diligence and board scrutiny, because every input can be audited. The account counts are an afternoon of work: LinkedIn Sales Navigator filters give company counts by industry, headcount, and geography, Apollo and Crunchbase give firmographic counts and funding filters, and your own closed-won data gives the honest ACV.
Value-theory sizing (what would the solved problem be worth?) is useful for pricing strategy and category creation, less so for sizing; our B2B SaaS pricing strategy guide covers that lens.
The worked example, end to end
Product: a deliverability monitoring platform sold to B2B agencies at $300/month, $3,600 ACV.
Step 1, TAM. Database and LinkedIn counts find roughly 40,000 marketing and lead-gen agencies in the target regions that run email as a service. TAM = 40,000 x $3,600 = $144M. Honest, and honestly the least useful number of the three.
Step 2, SAM. Apply the real filters: 10-200 employees (below that they will not pay, above that they build in-house), English-speaking markets, actively running cold outbound (observable via job posts and tech signals). The count drops to ~12,000 accounts. SAM = 12,000 x $3,600 = $43M.
Step 3, SOM from capacity, not vibes. Two AEs, each closing five deals a month at steady state, is ~120 new customers a year; with ramp and churn, call it 360 customers by end of year three. SOM = 360 x $3,600 = ~$1.3M ARR, roughly 3% of SAM. That number connects directly to pipeline math: at a 25% win rate it implies ~1,440 opportunities over three years, which your MQL-to-SQL conversion rates translate into a required lead volume. If the required lead volume is implausible, the SOM was too.
The sanity checks. ACV comes from closed-won data, not aspiration. The account count excludes companies that structurally cannot buy (wrong stack, wrong compliance regime). And the three numbers should be far apart: a SAM that is 90% of TAM means the filters were cosmetic, a SOM above ~10% of SAM in three years needs an extraordinary distribution story to defend.
Where each number actually gets used
TAM belongs in fundraising narratives and category bets: it answers "is the ceiling high enough". SAM drives go-to-market design: ICP definition, territory planning, channel budgets, and whether the pipeline math in your plan is physically possible. SOM sets the revenue plan, headcount model, and quota capacity, and connects sizing to strategy choices like ABM tiers (a small SAM of high-ACV accounts wants ABM; a wide SAM of small accounts wants volume motions per our GTM motion comparison). Re-run the build yearly: ACV moves, filters sharpen, and a sizing model that never changes is a sizing model nobody uses.
FAQ
What is the difference between TAM, SAM and SOM?
TAM is total demand for the category (all possible buyers x ACV), SAM is the portion your product and channels can actually serve after segment, geography, and capability filters, and SOM is the share you can realistically win in 2-3 years given sales capacity and win rates.
How do you calculate TAM bottom-up?
Count the companies that fit your buyer profile using database and LinkedIn filters, then multiply by an achievable annual contract value taken from real closed-won data. Bottom-up TAM = target accounts x ACV, with every input auditable.
What percentage of SAM should SOM be?
There is no magic percentage: build SOM from sales capacity (reps x deals per rep x timeframe, adjusted for ramp and churn) and then express it as a share of SAM. In practice credible three-year SOMs often land in the low single digits of SAM; above ~10% requires an unusual distribution advantage to defend.
What data sources work for B2B market sizing?
LinkedIn Sales Navigator for company counts by size, industry, and geography; Apollo or similar B2B databases for firmographic and technographic filters; Crunchbase for funding-stage cuts; Statista, Gartner, and market intelligence platforms for top-down context; and your own CRM for the only ACV that matters.
Is top-down or bottom-up market sizing better?
Bottom-up is the number people trust, because accounts-times-price can be audited input by input. Top-down is useful as a sanity check and for citing market momentum. Present bottom-up as the case and top-down as the context, never the reverse.
How often should you recalculate TAM SAM SOM?
Yearly as a rhythm, and immediately after anything that changes the filters: a new product line, a new geography, a pricing change, or a pivot in ICP. SAM and SOM move much faster than TAM, and they are the two numbers your plan actually runs on.
Bottom line
TAM SAM SOM done right is one multiplication done three times with progressively honest filters: all accounts x ACV, serviceable accounts x ACV, winnable accounts x ACV. Build it bottom-up, source the counts from databases you can re-run, derive SOM from rep capacity, and let the three numbers drive fundraising, go-to-market design, and the revenue plan respectively.
Want the sizing wired into an actual pipeline plan, from account counts to quota math? Book a call with GROU. We build go-to-market engines for B2B companies across verticals.
We are GROU, a B2B pipeline agency that runs lead generation, outbound, and LinkedIn content for clients across manufacturing, fintech, iGaming, software, and professional services. The sizing method reflects the market builds we run for client go-to-market plans between 2024 and 2026, anonymized to protect client confidentiality.
Some links in this article are affiliate. We may earn a small commission at no extra cost to you. We only recommend tools we've deployed for clients.

Pipeline OS Newsletter
Build qualified pipeline
Get weekly tactics to generate demand, improve lead quality, and book more meetings.





Trusted by industry leaders
Trusted by industry leaders
Trusted by industry leaders
Ready to build qualified pipeline?
Ready to build qualified pipeline?
Ready to build qualified pipeline?
Book a call to see if we're the right fit, or take the 2-minute quiz to get a clear starting point.
Book a call to see if we're the right fit, or take the 2-minute quiz to get a clear starting point.
Book a call to see if we're the right fit, or take the 2-minute quiz to get a clear starting point.
" height="30.21639343089746px" id="hfGbXmQR2" width="30.216393430897455px"/></svg>)
Copyright © 2026 – All Right Reserved
Copyright © 2026 – All Right Reserved
Copyright © 2026 – All Right Reserved